
📈
View item analytics
Introduction
Viewing item analytics is highly valuable because it helps assess the effectiveness of questions, see which topics students struggle the most, improve assessment quality and enhance student's learning.
In this article, we will explore how to view the analytics of the activity items in GradeChum.
Steps
To view item analytics, follow the steps below:
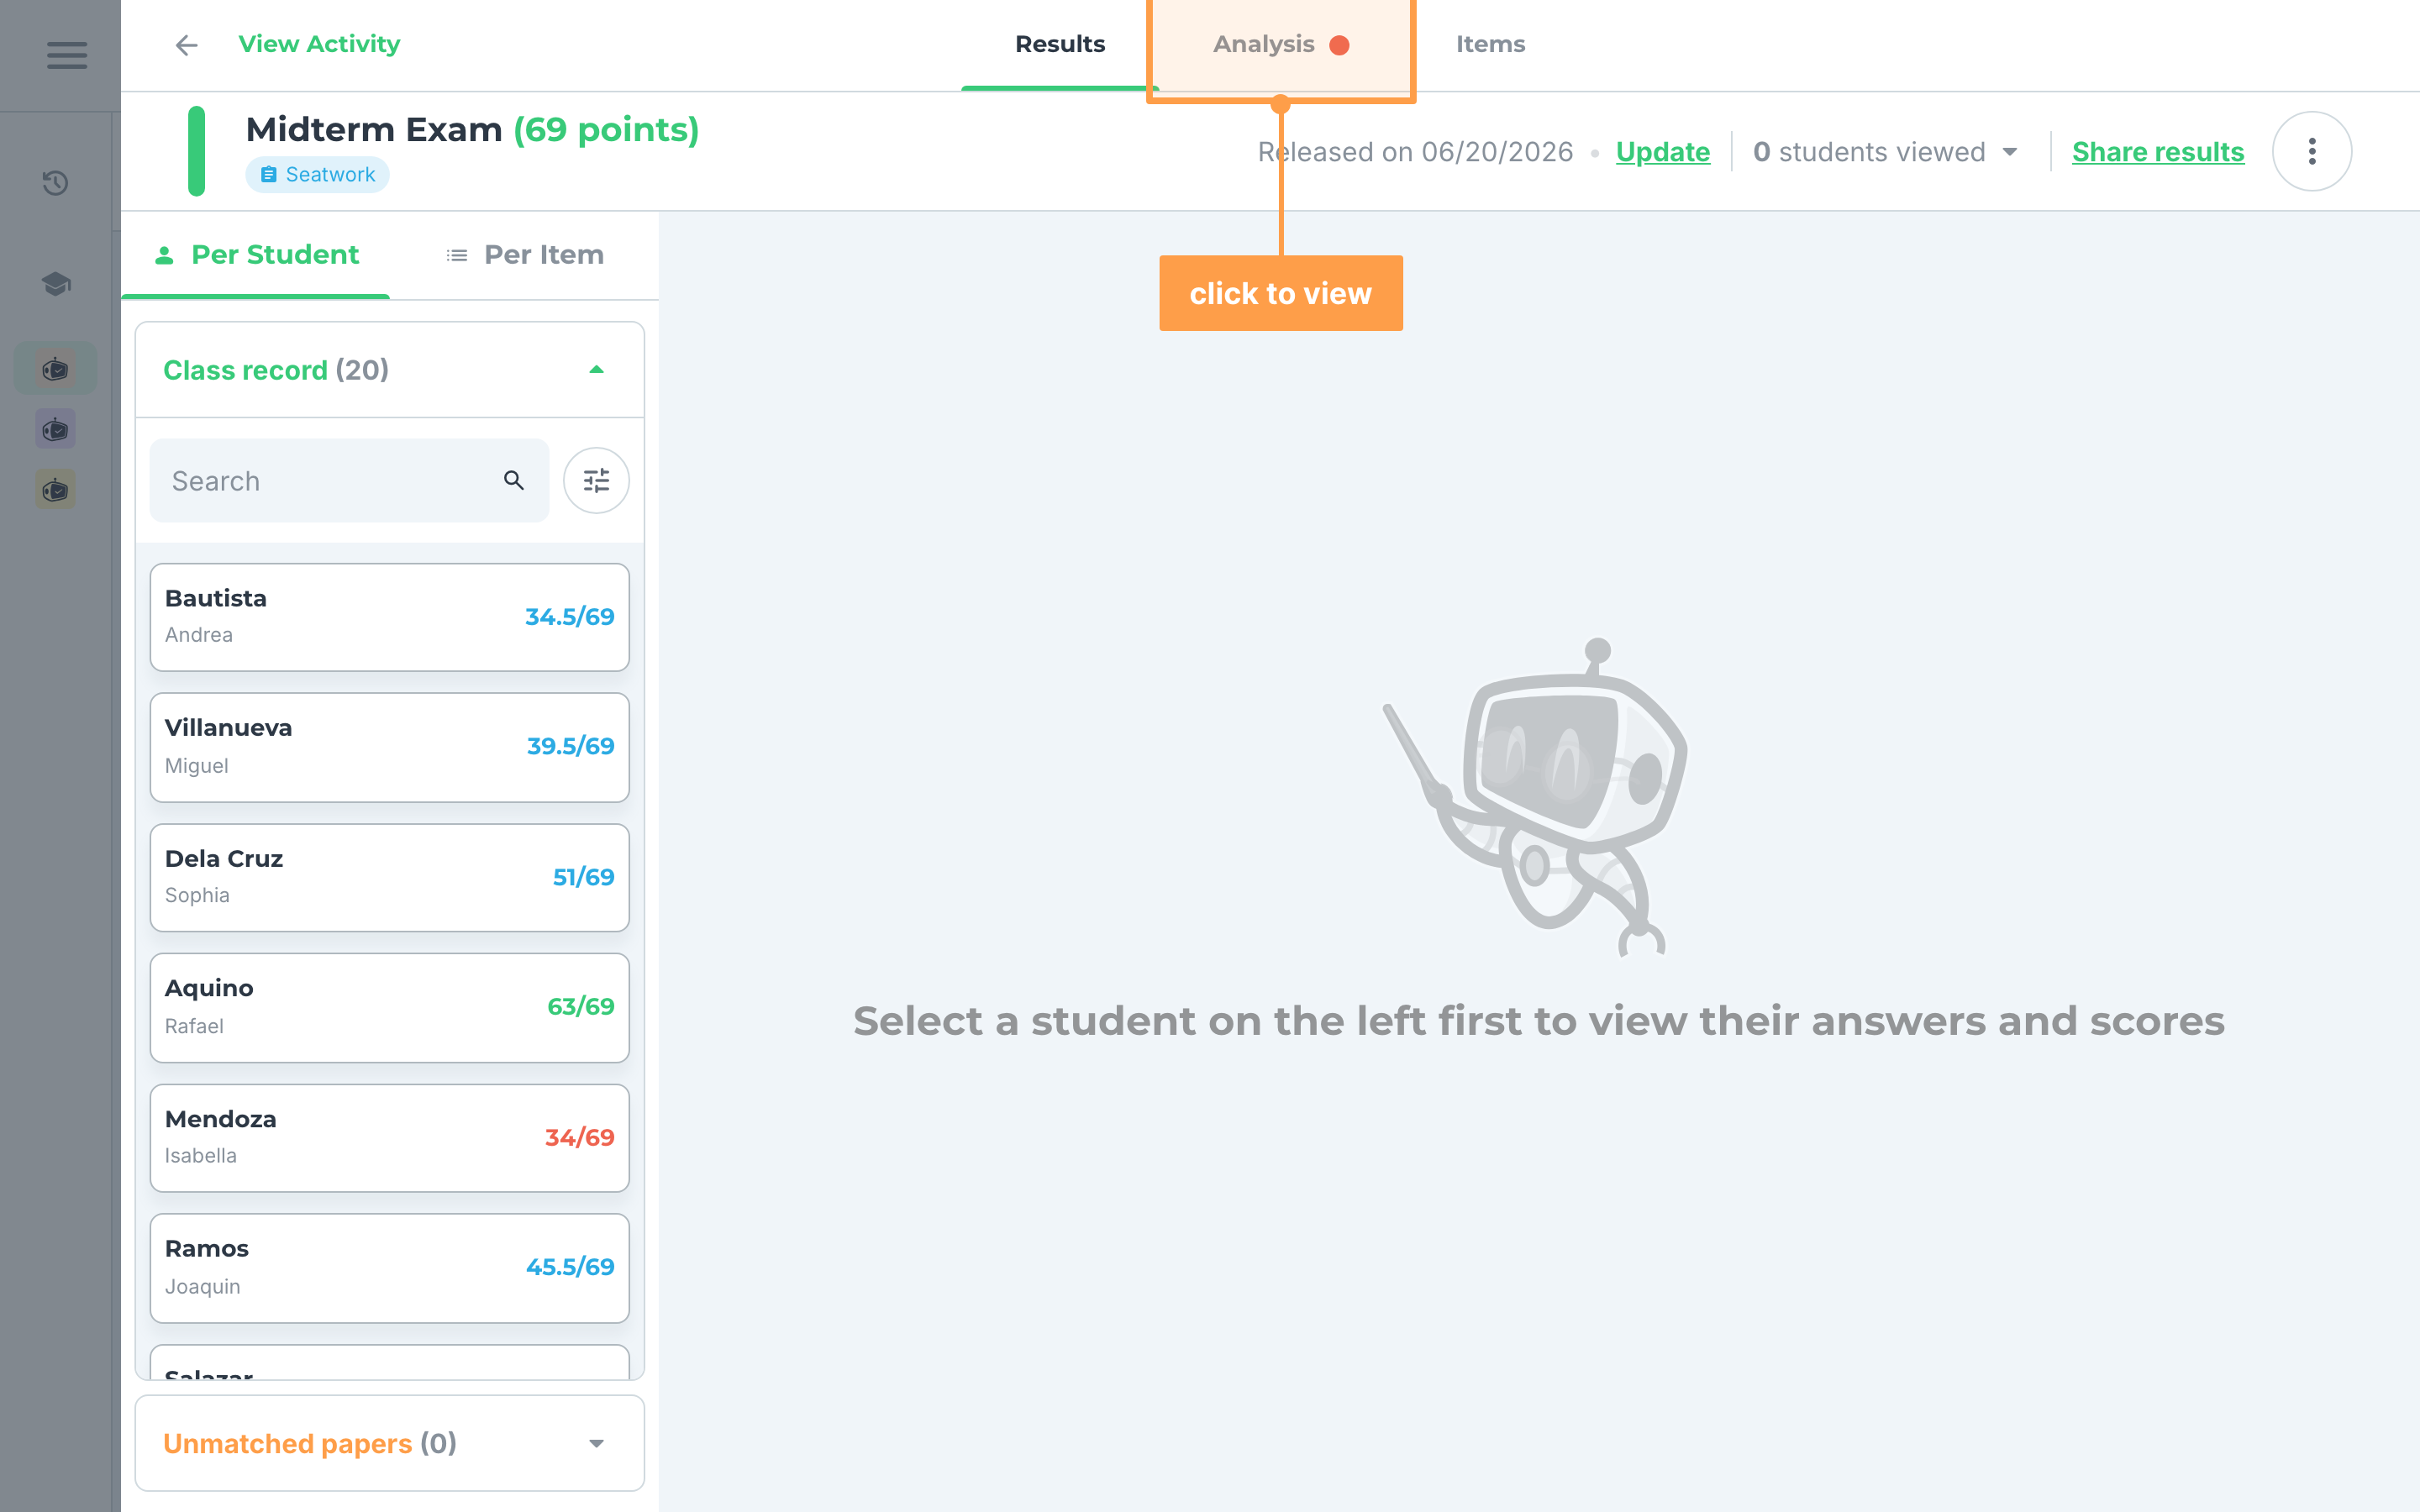
- View the activity and click on the Analysis tab.
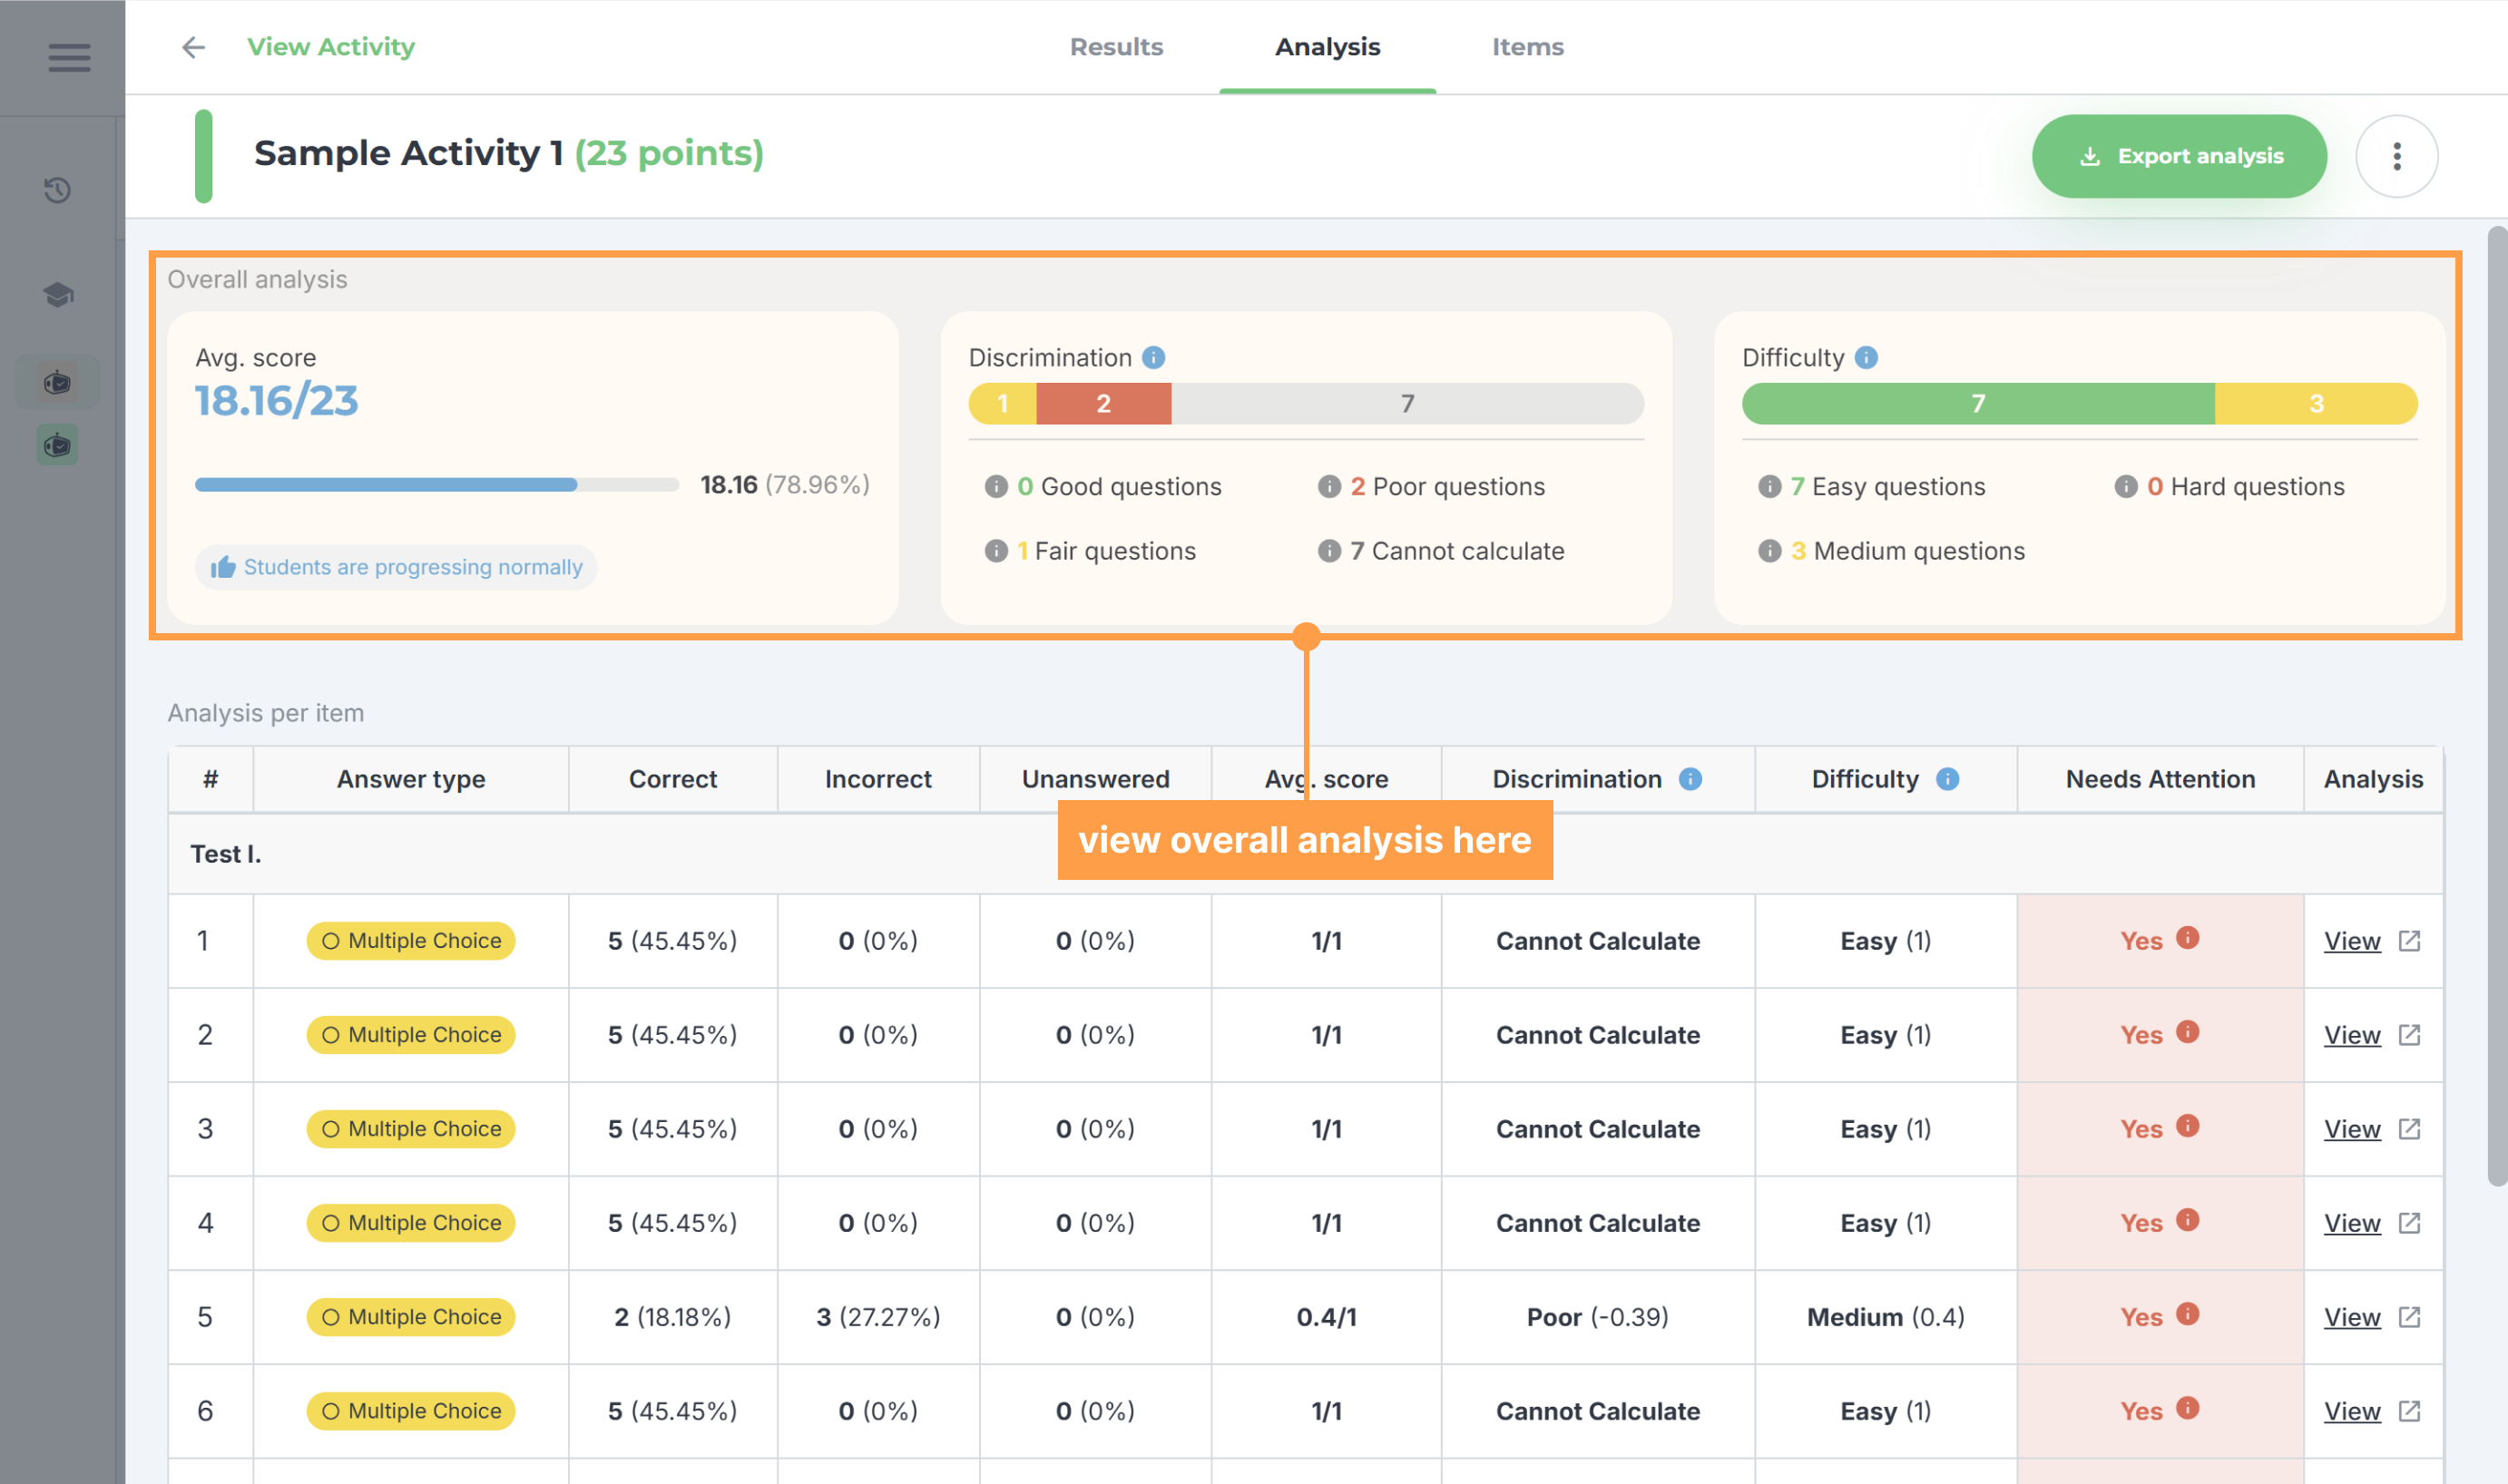
- The tab will then show the analytics of the class, showing the Average score of the class, as well as the Discrimination and Difficulty value of the items in the activity.
- You can also view the analysis per item and there are three ways to do so. See below:
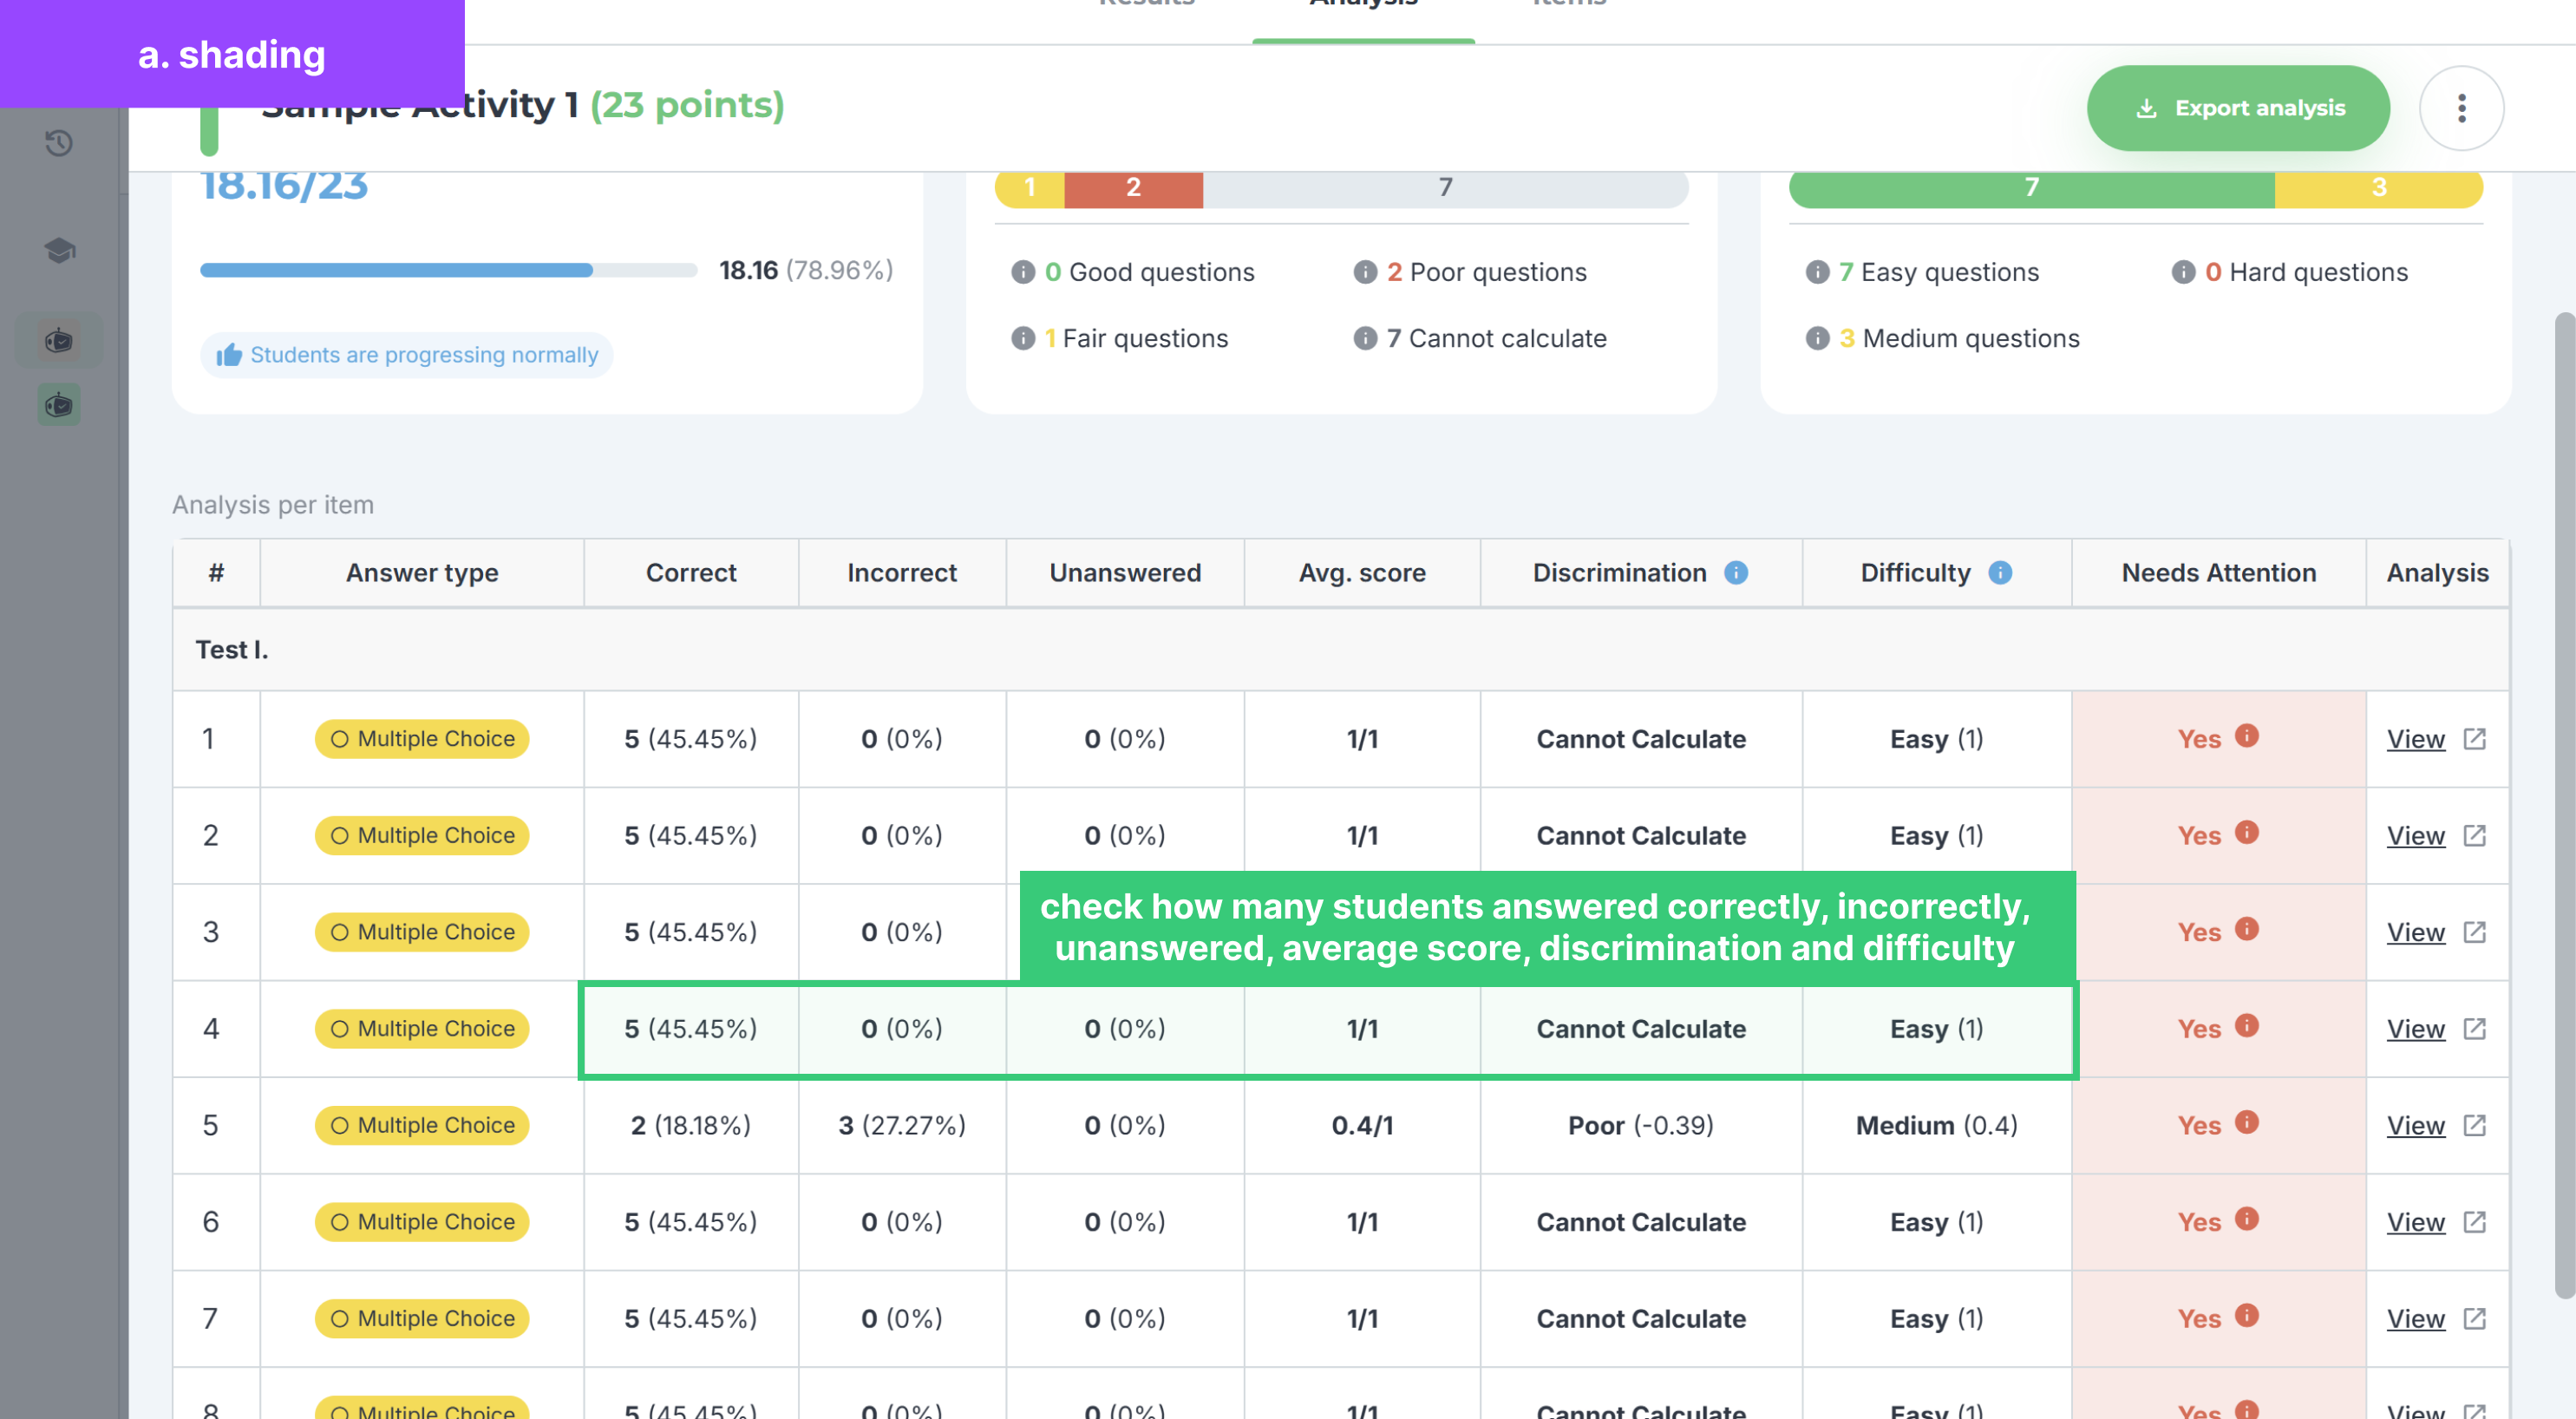
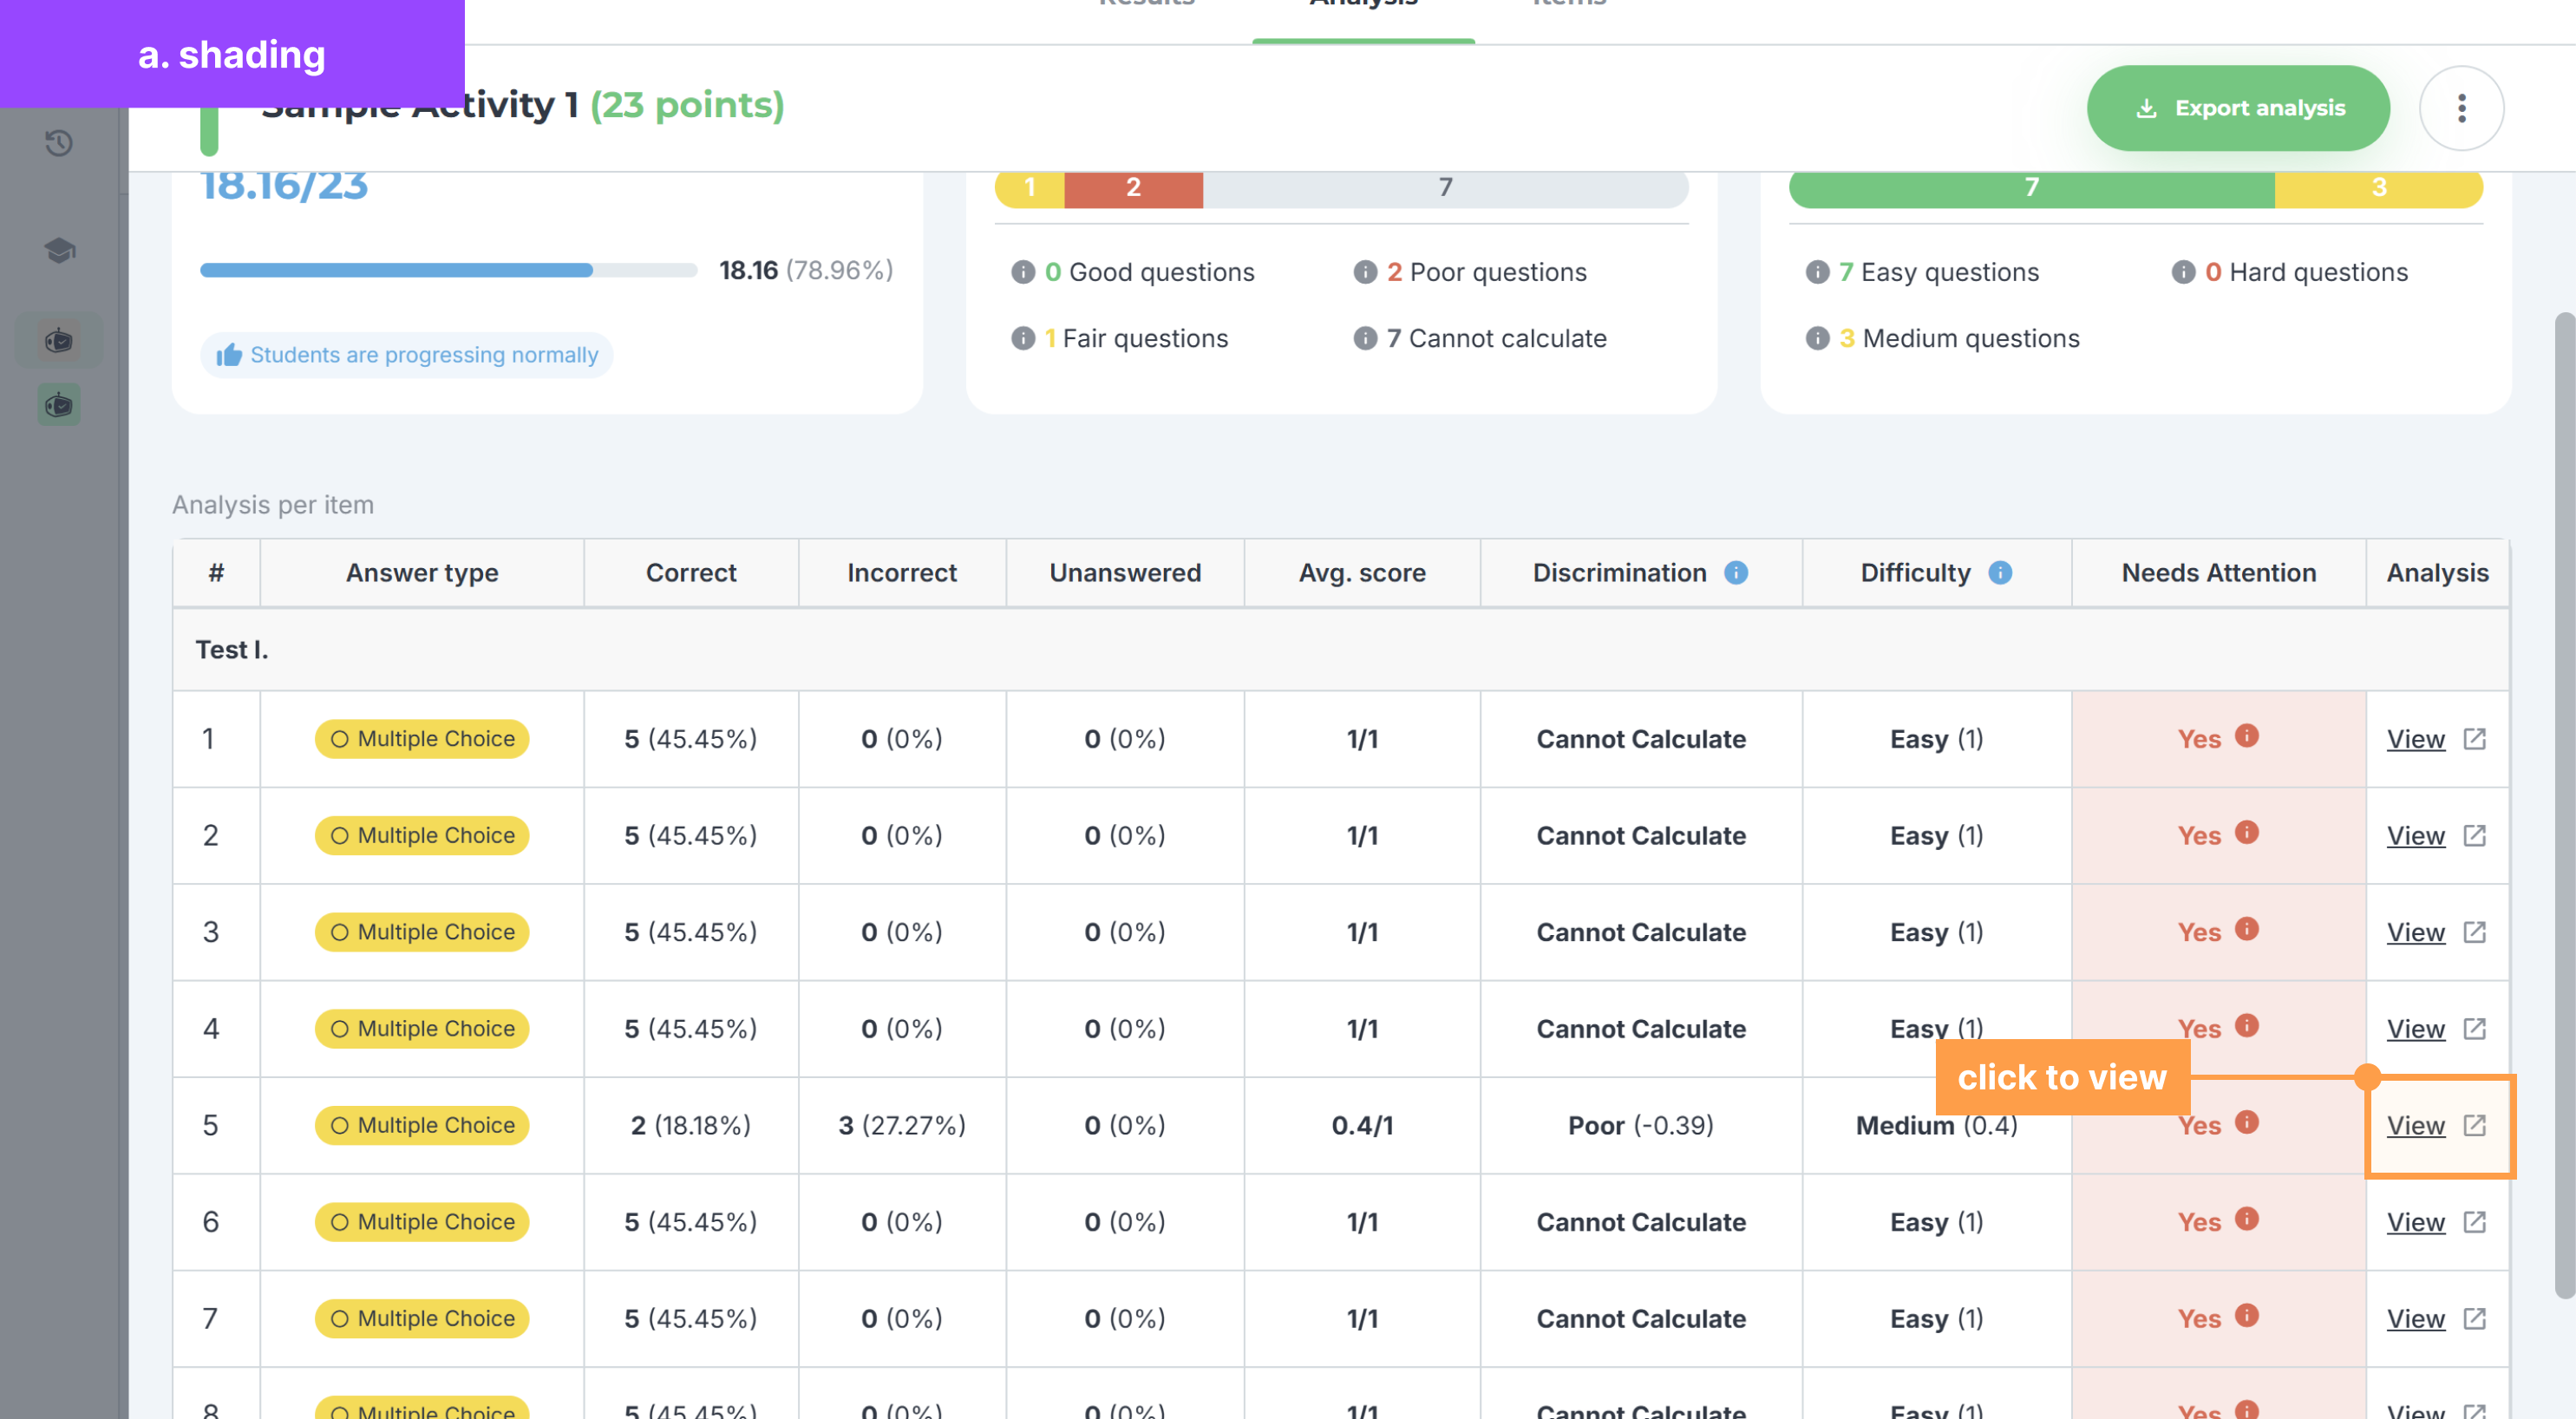
a. Shading
- View how many students answered the question Correctly, Incorrectly, and Unanswered. You can also view here the Average score, Discrimination, and Difficulty value of the item.
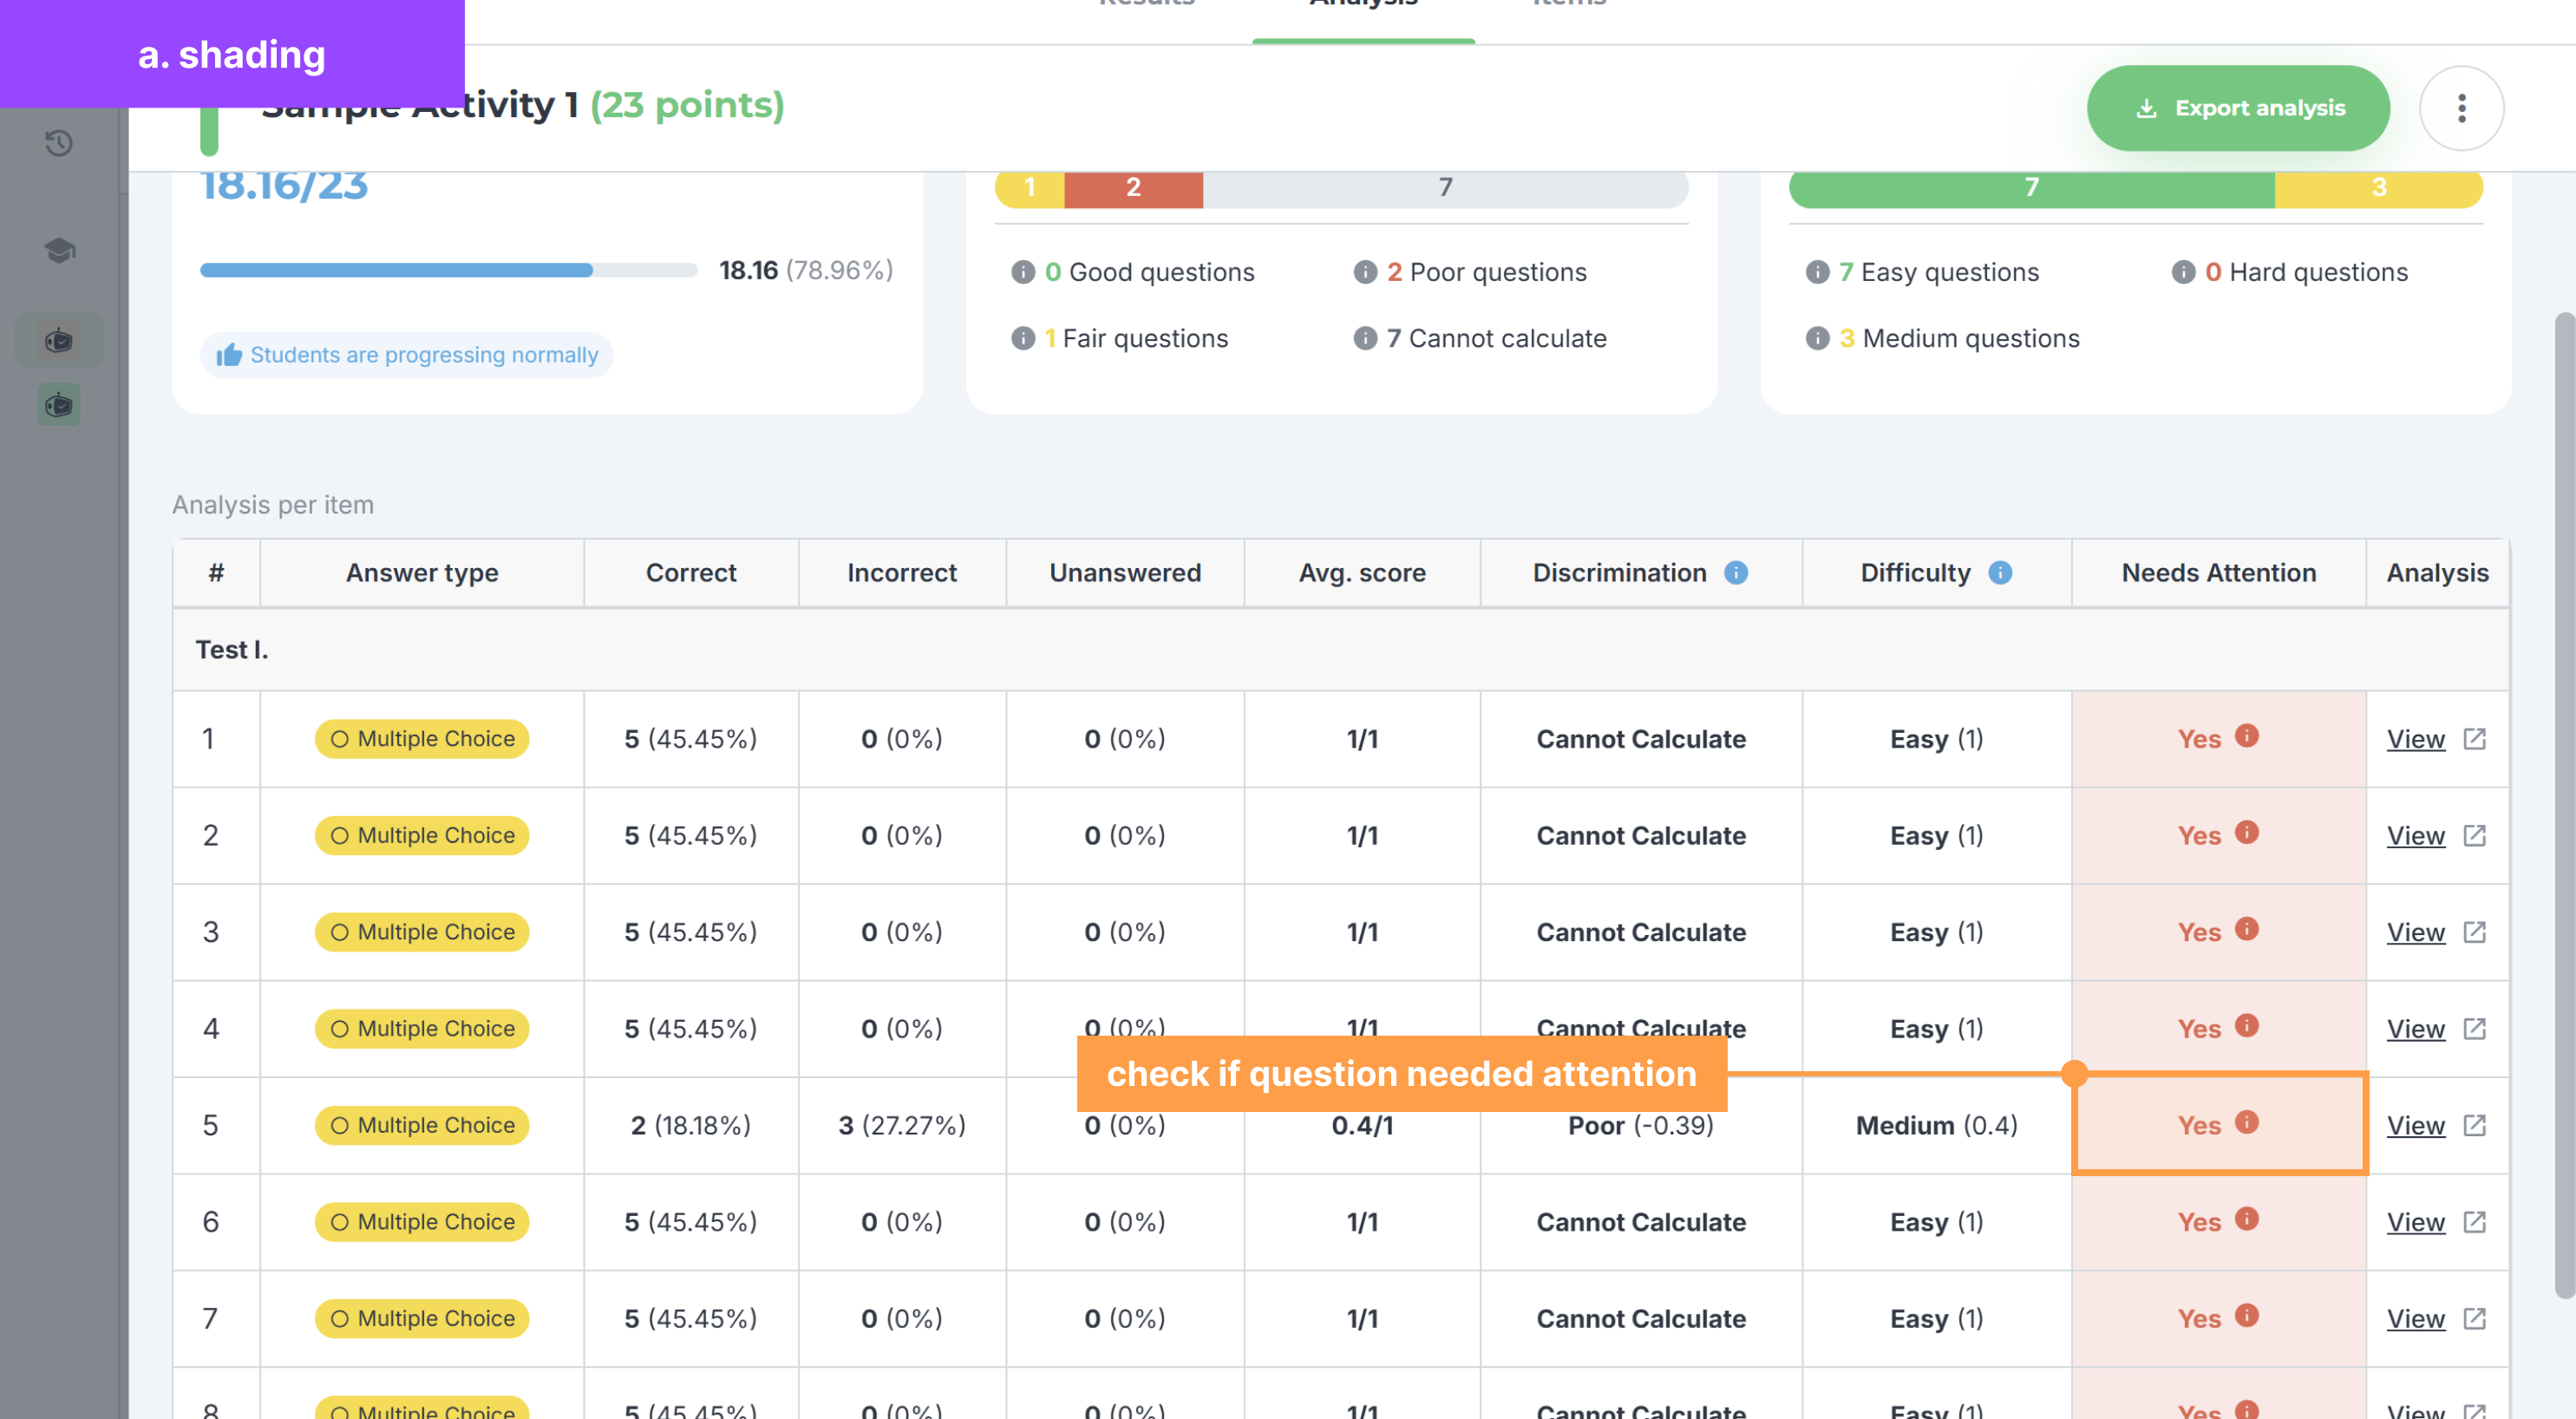
- You can also see which questions “Needs Attention” indicated by Yes or No in the column.
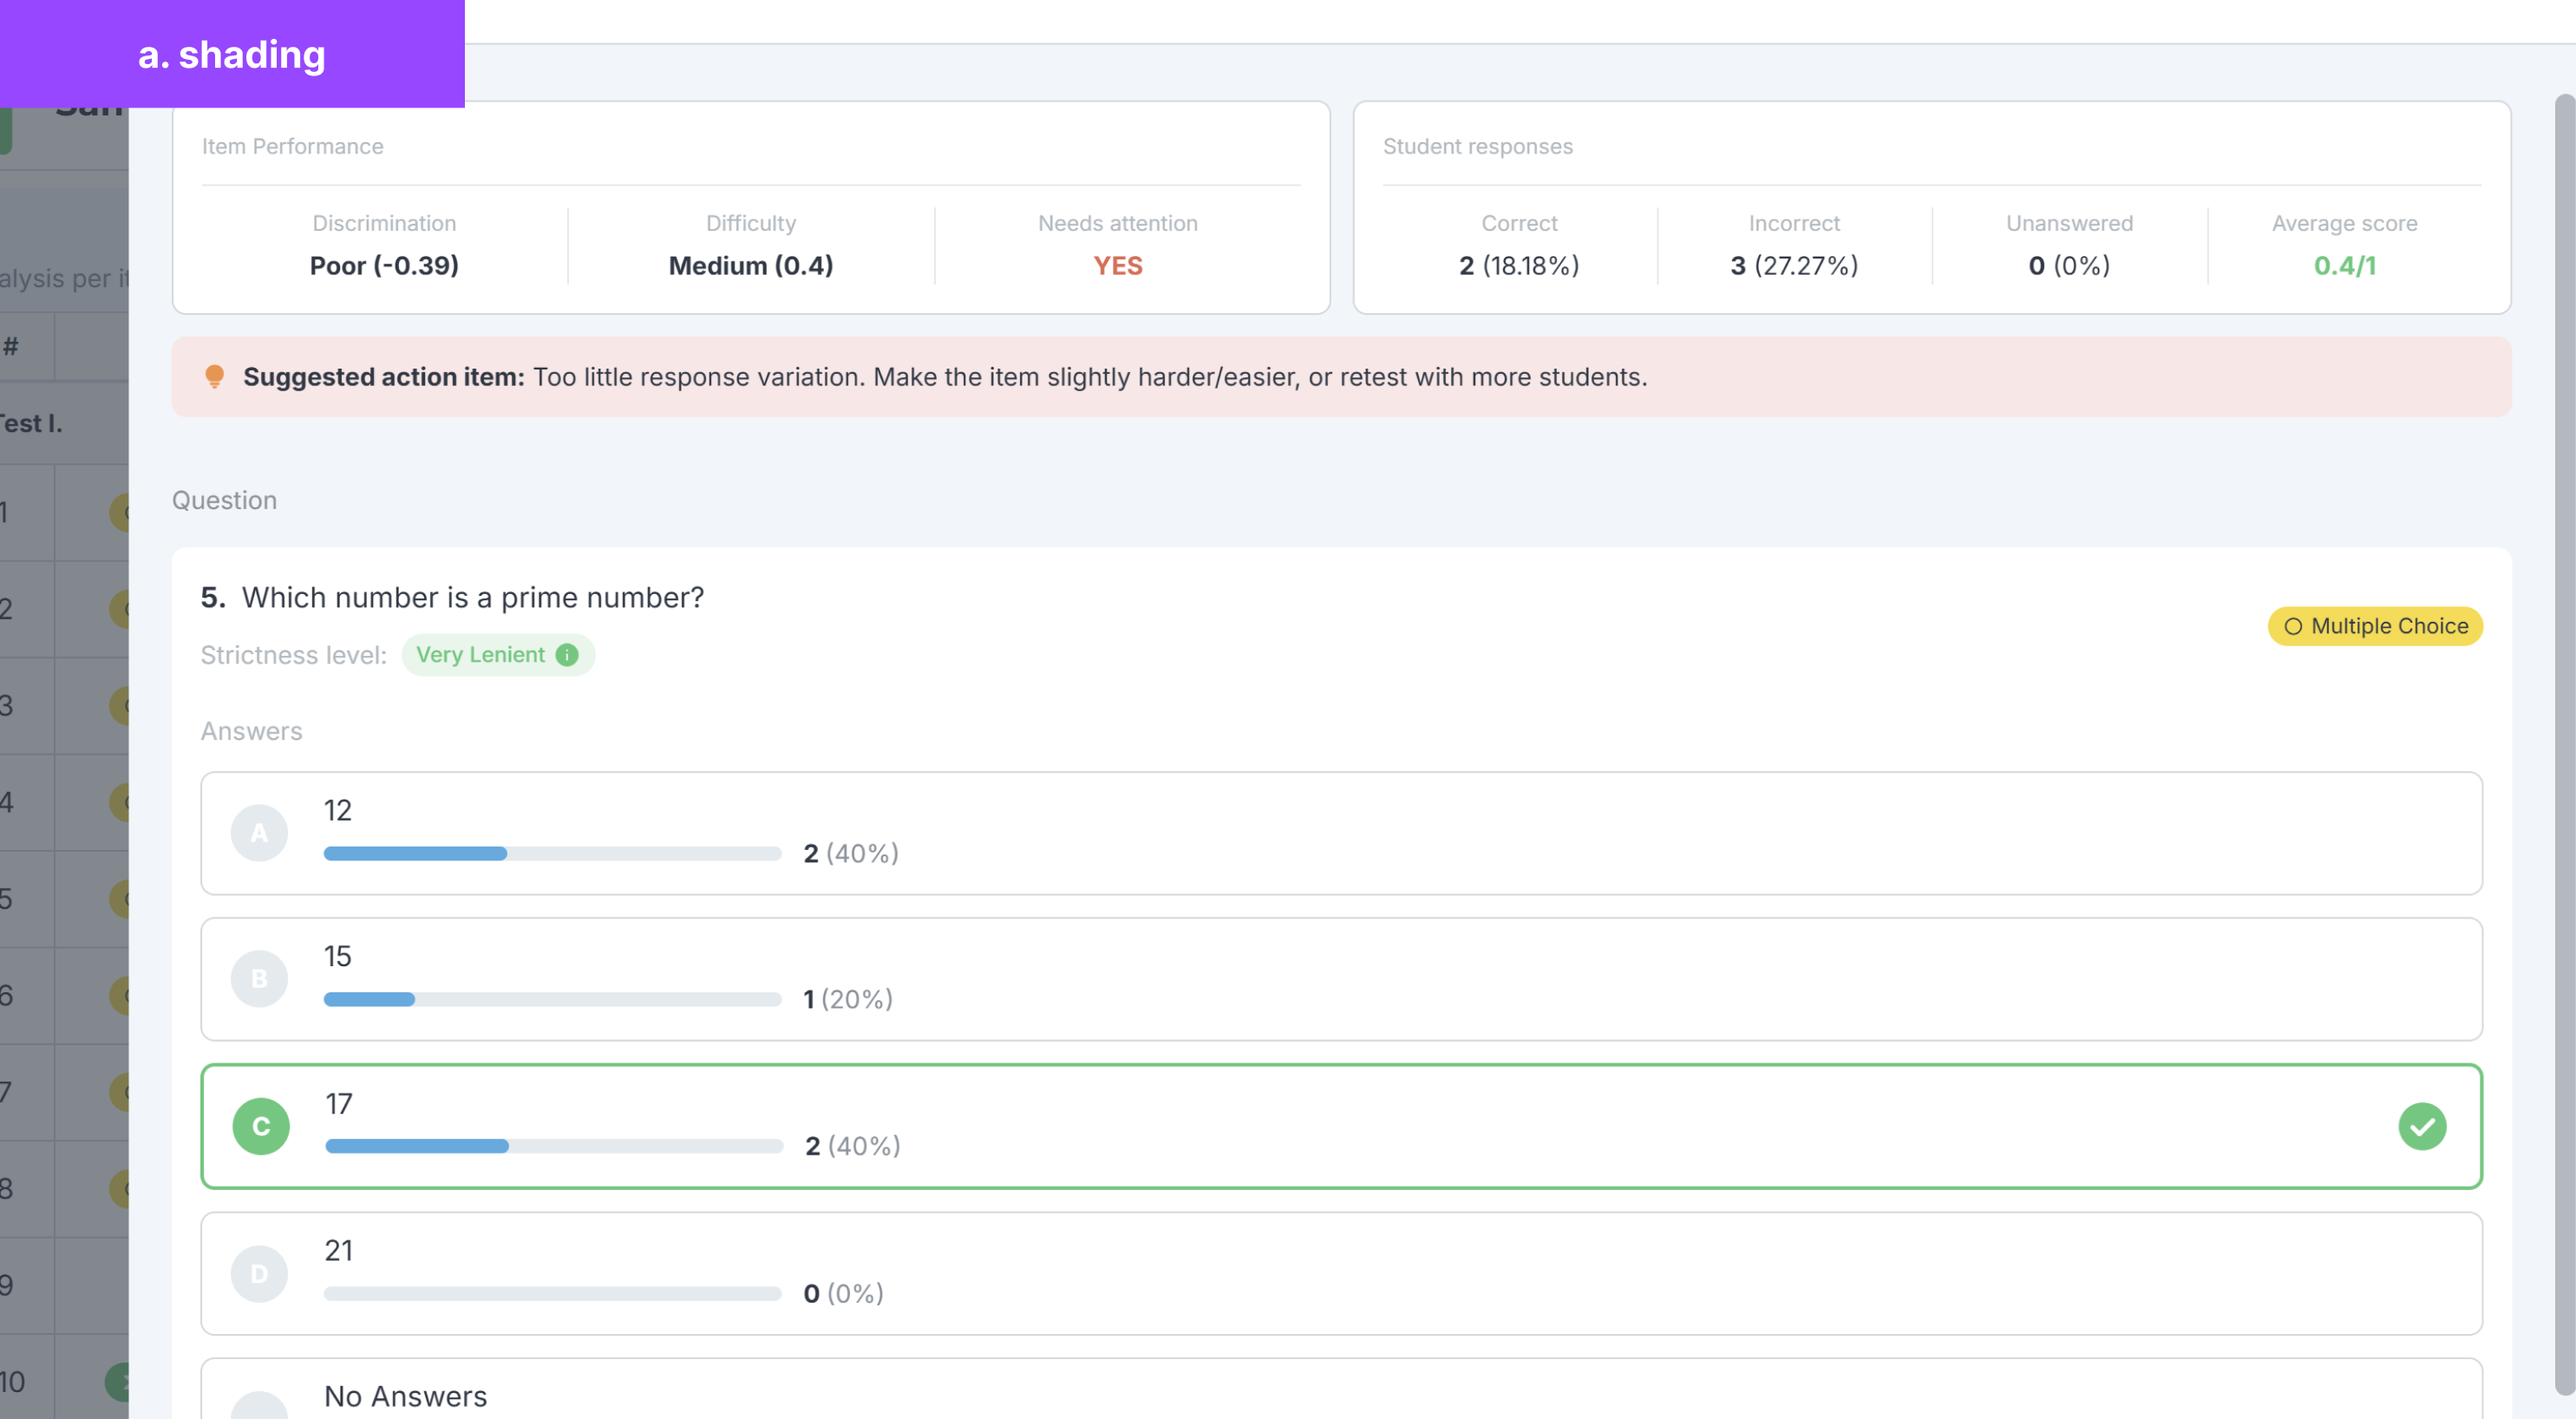
- Then, click the “View” for a page to open that shows the question’s analytics.
- Once it is open, the page will show the analysis of the item and the number of students who answered each option.
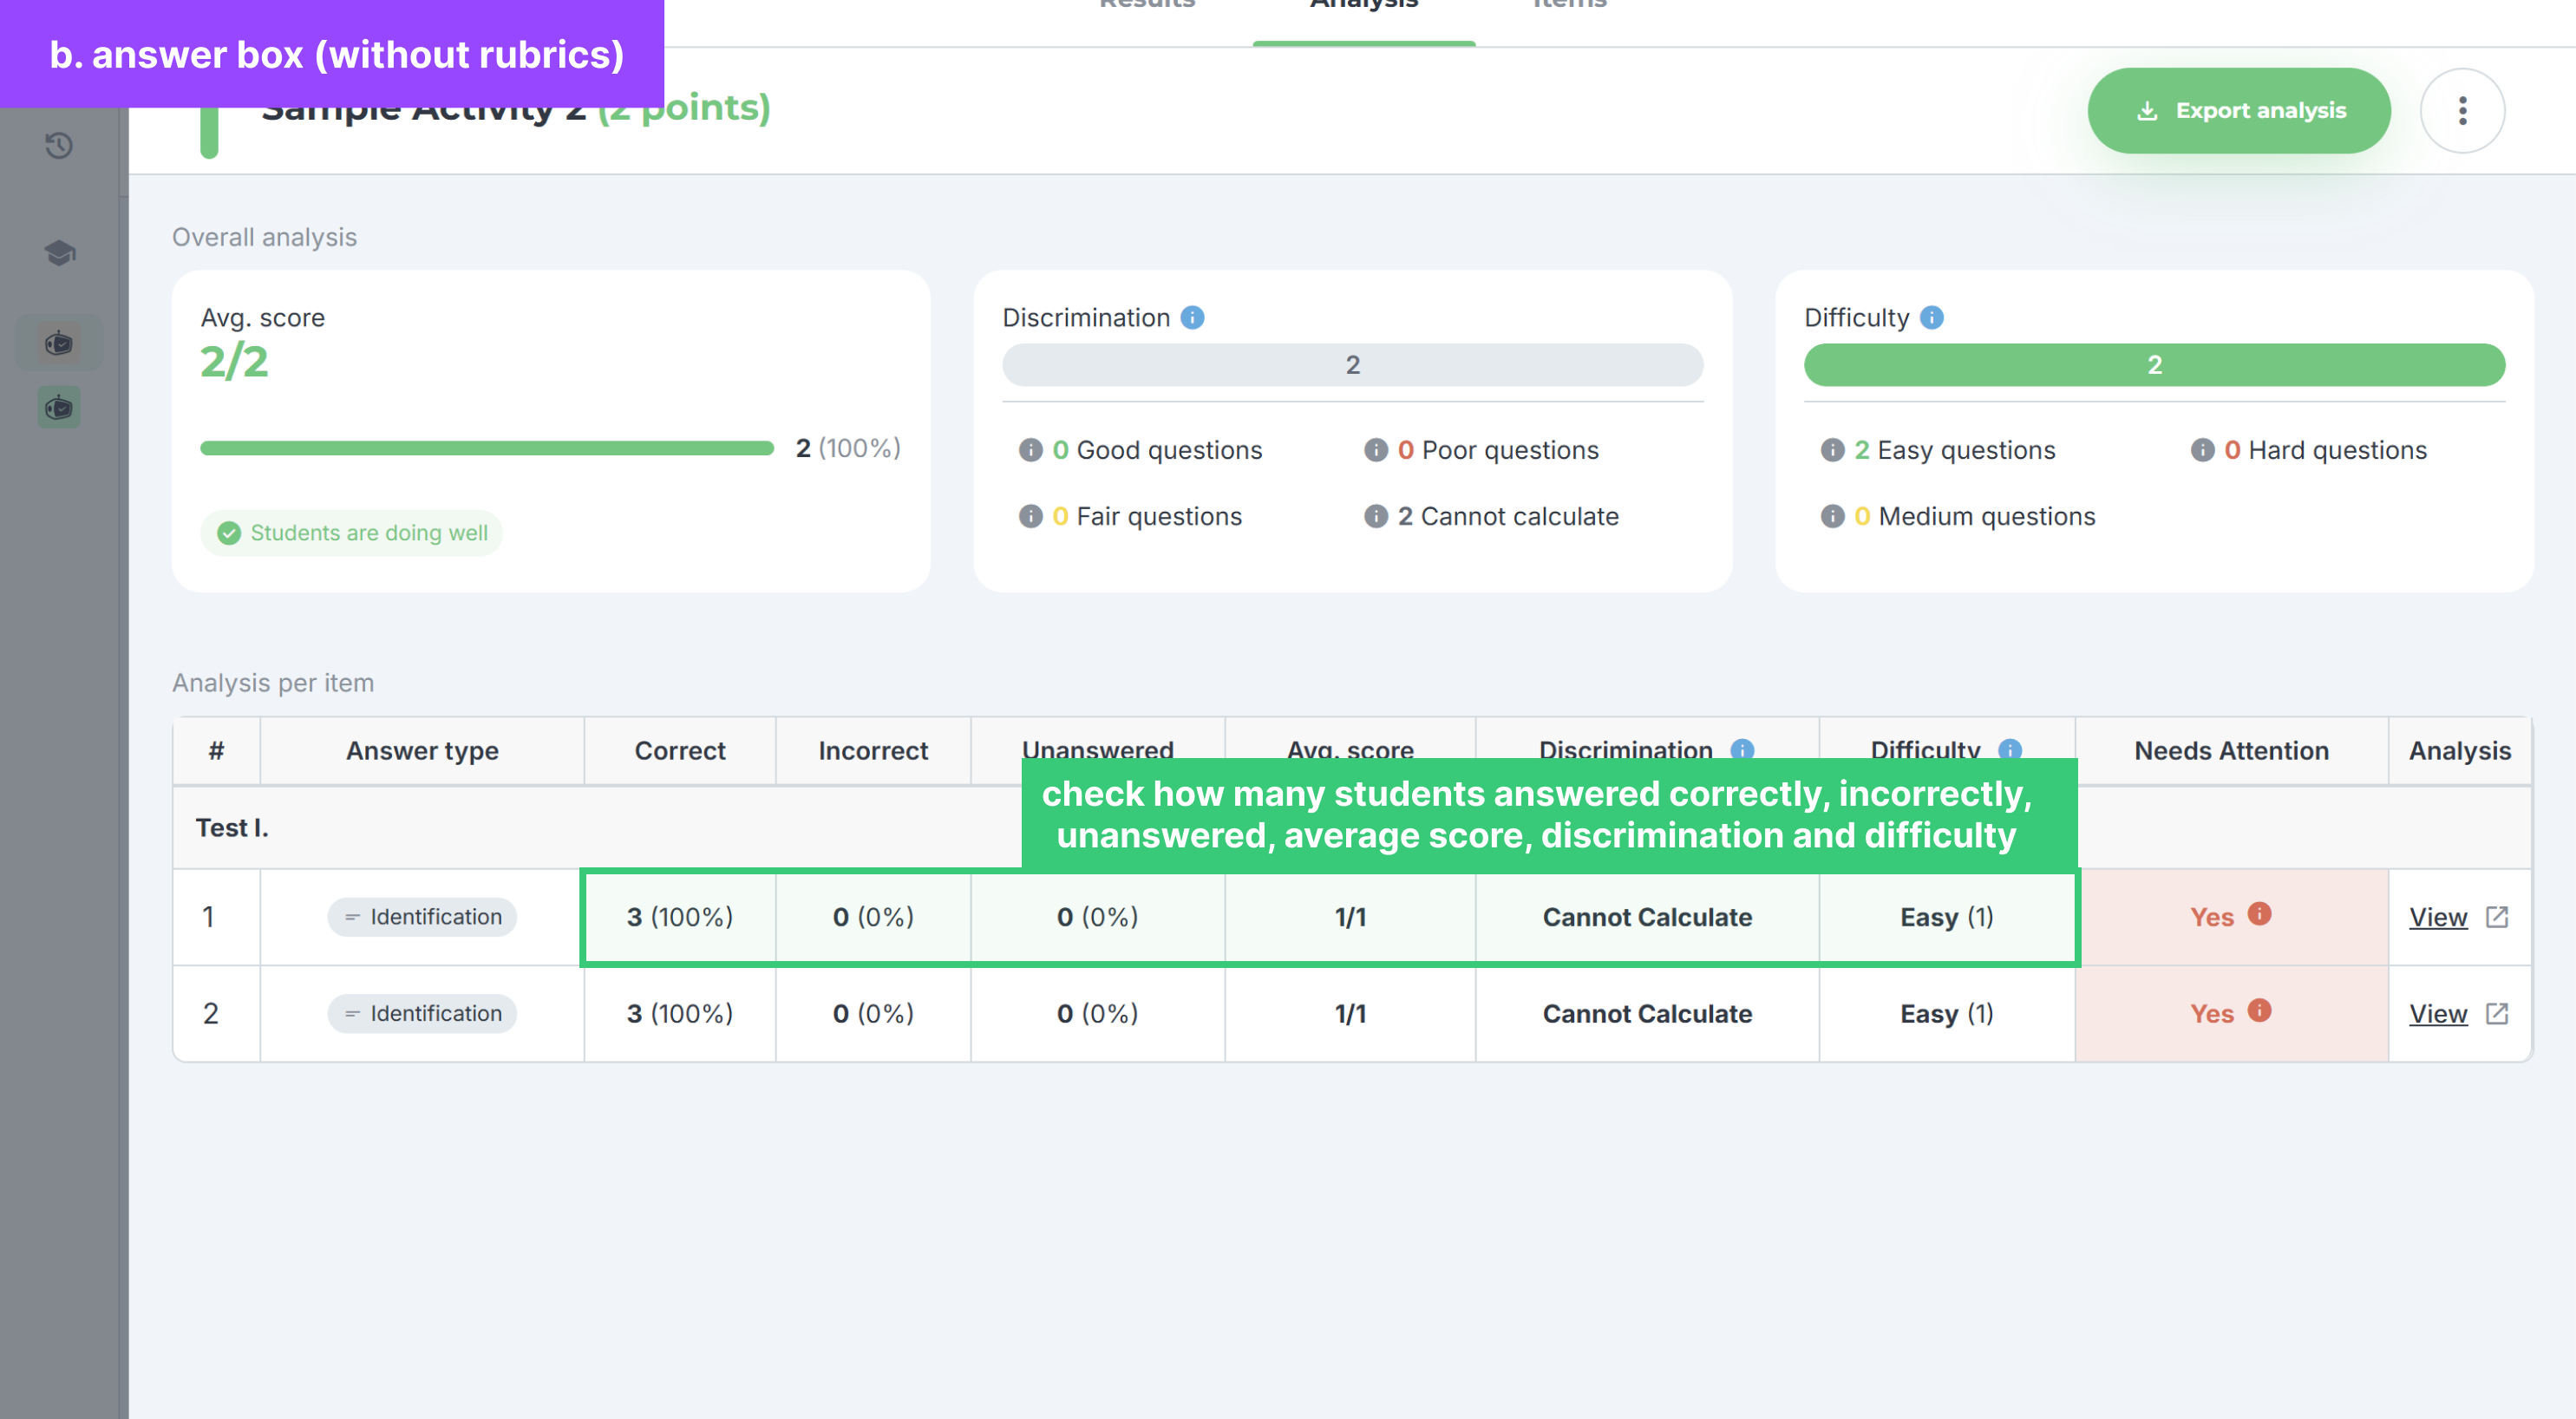
b. Answer Box (without rubrics)
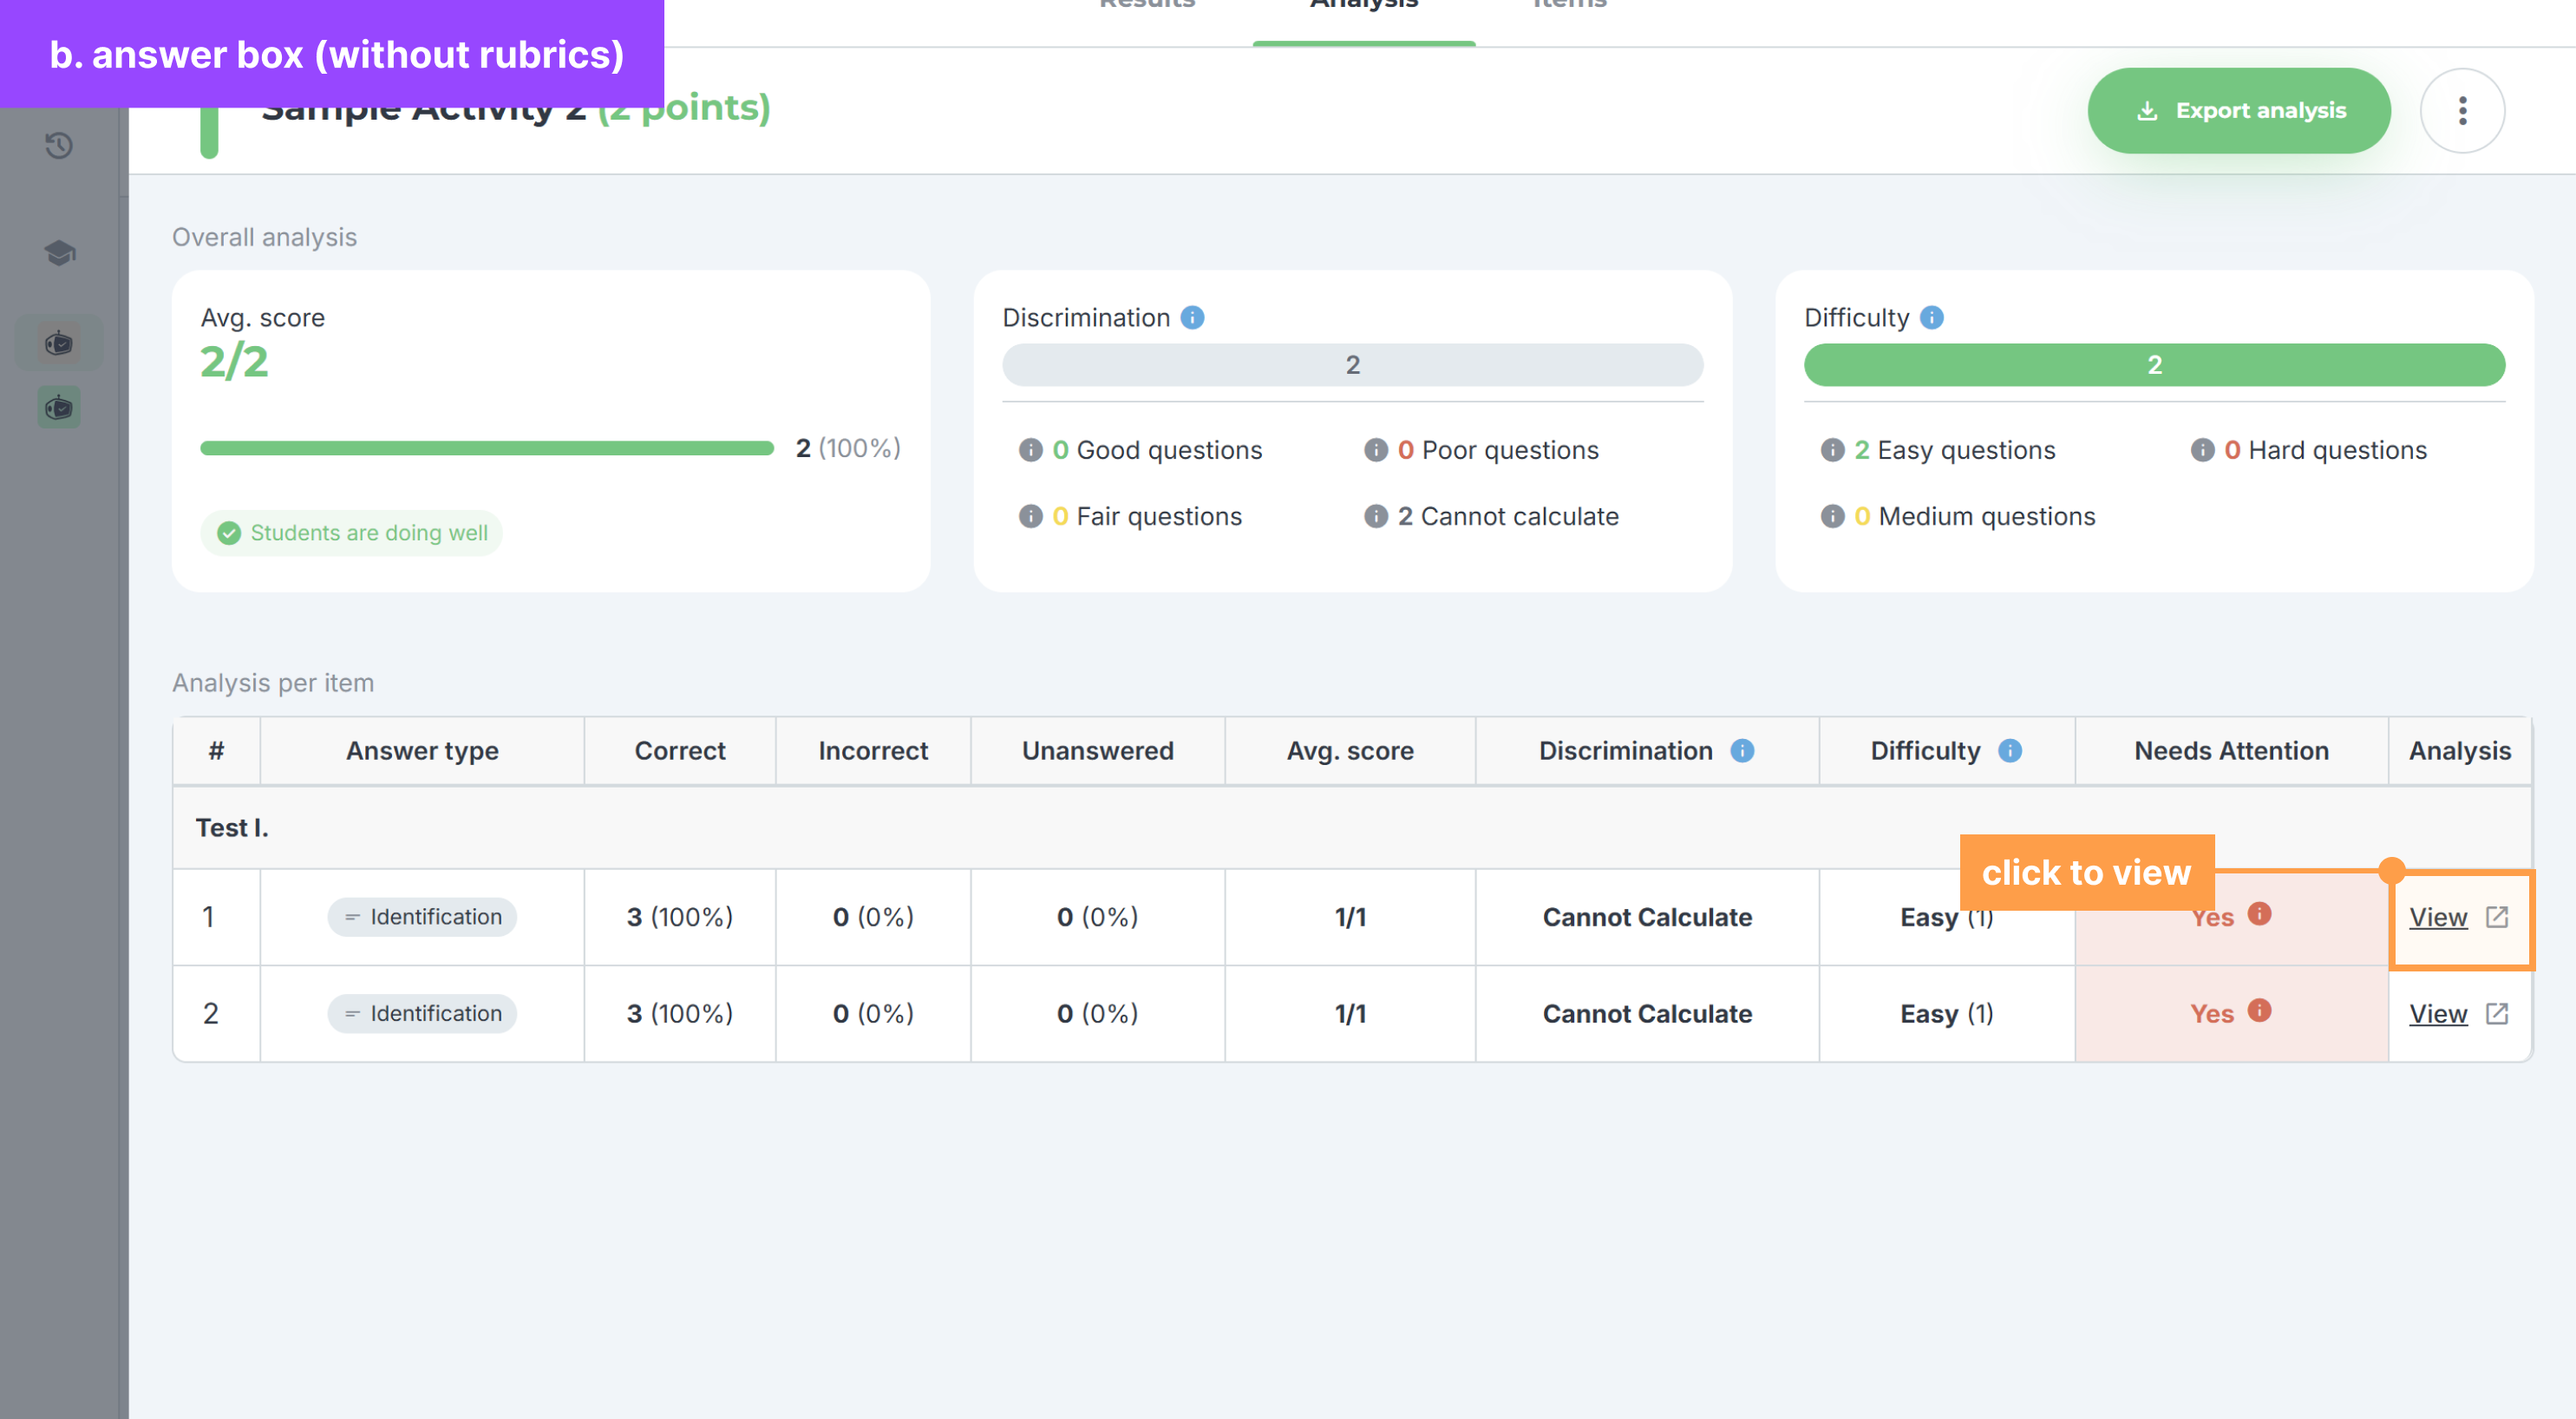
- View how many students answered the question Correctly, Incorrectly, and Unanswered. You can also view here the Average score, Discrimination, and Difficulty value of the item.
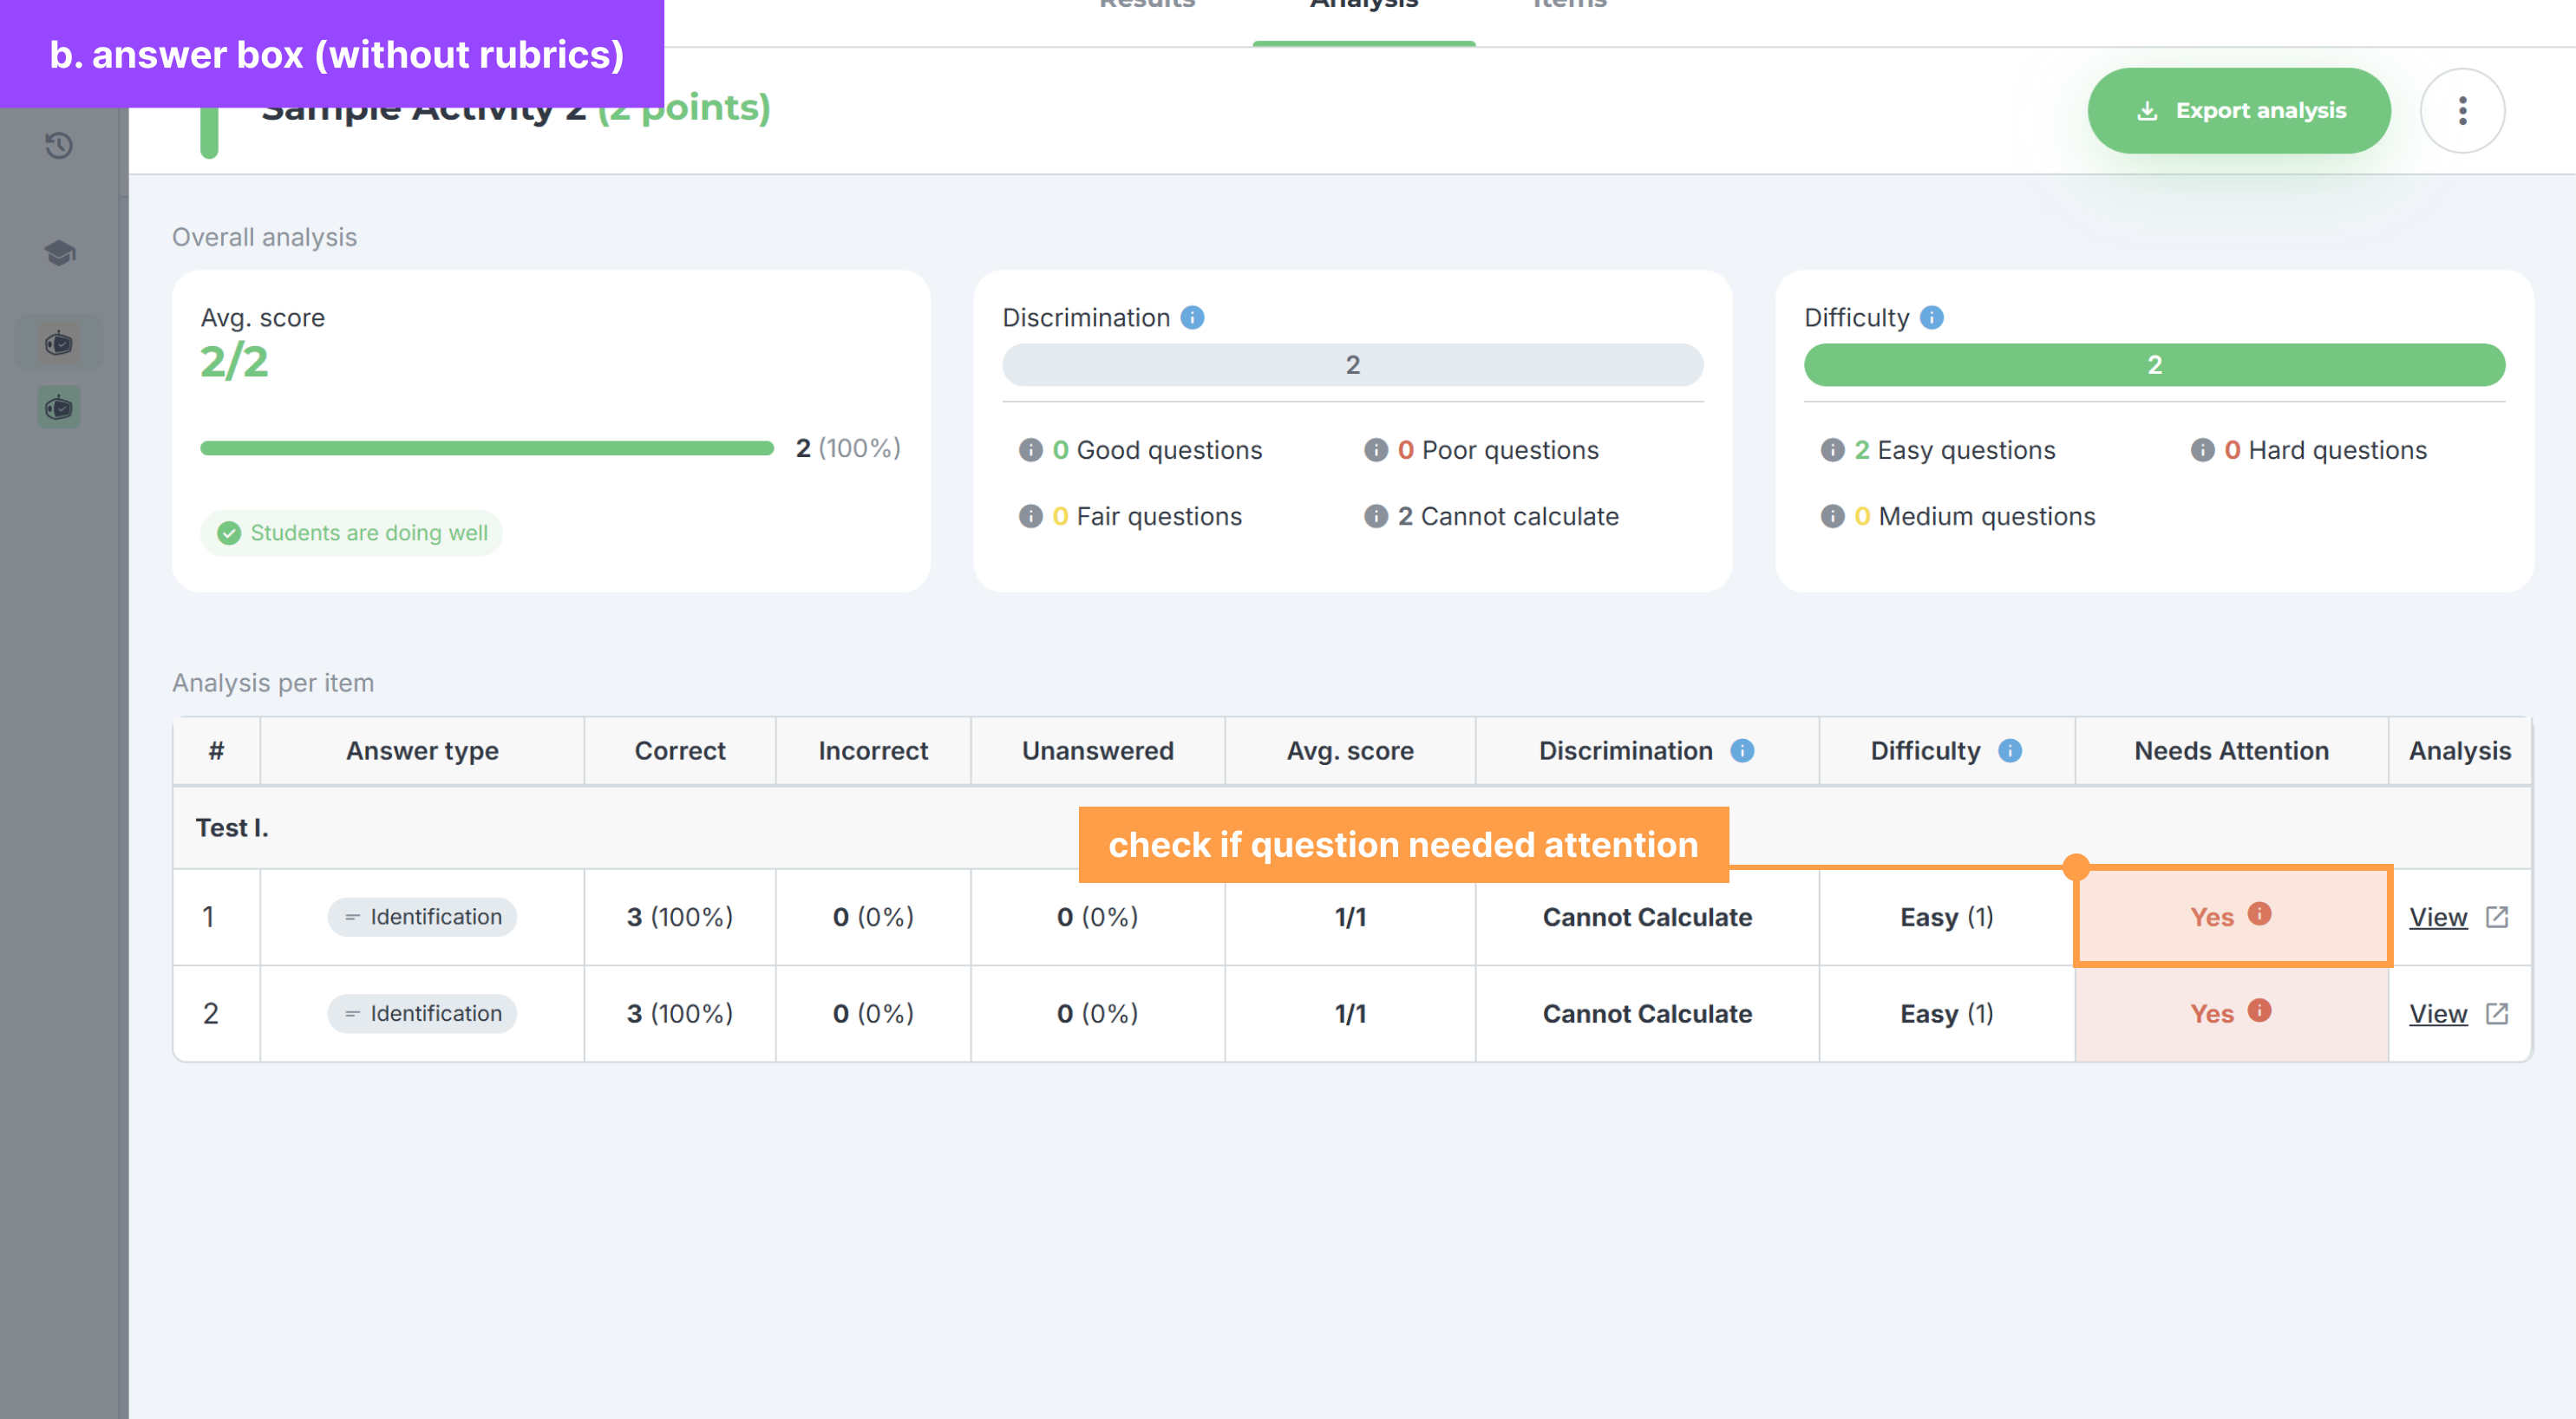
- You can also see which questions “Needs Attention” indicated by Yes or No in the column.
- Then, click the “View” for a page to open that shows the question’s analytics.
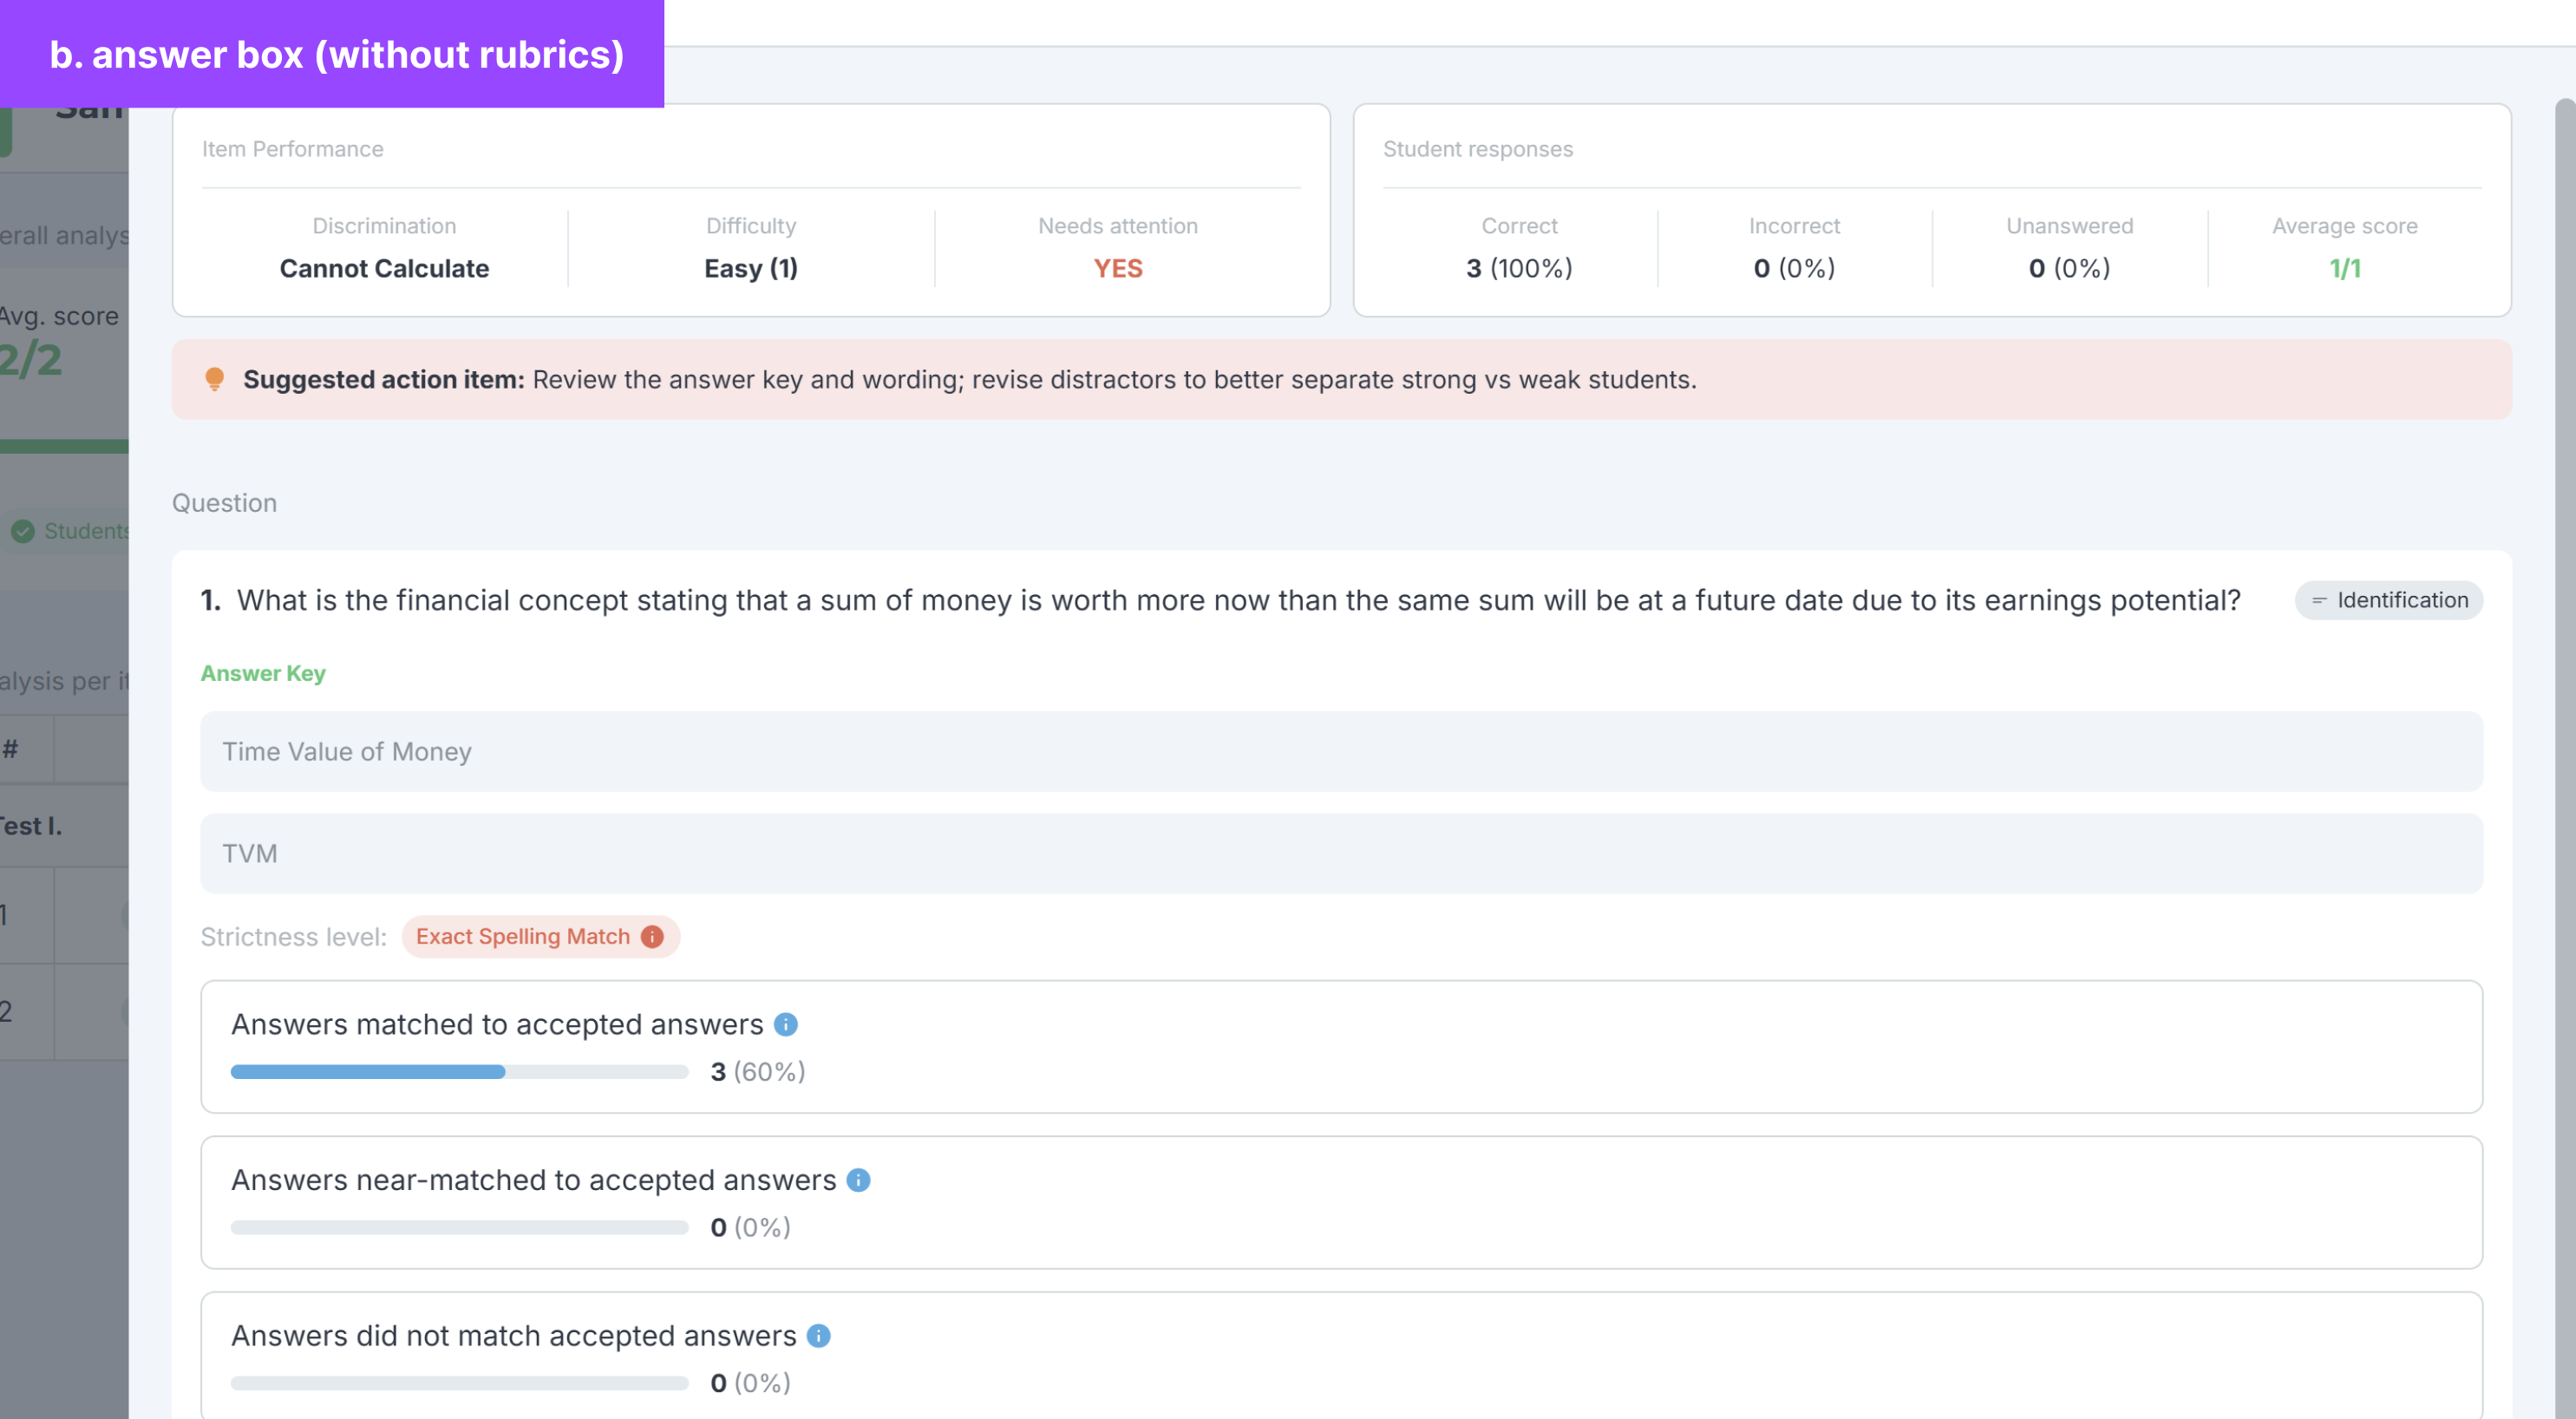
- Once it is open, the page will show the analysis of the item, the answer key, the strictness level, and how many students' answers matched, near-matched, or did not match the accepted answers.
c. Answer Box (with rubrics)
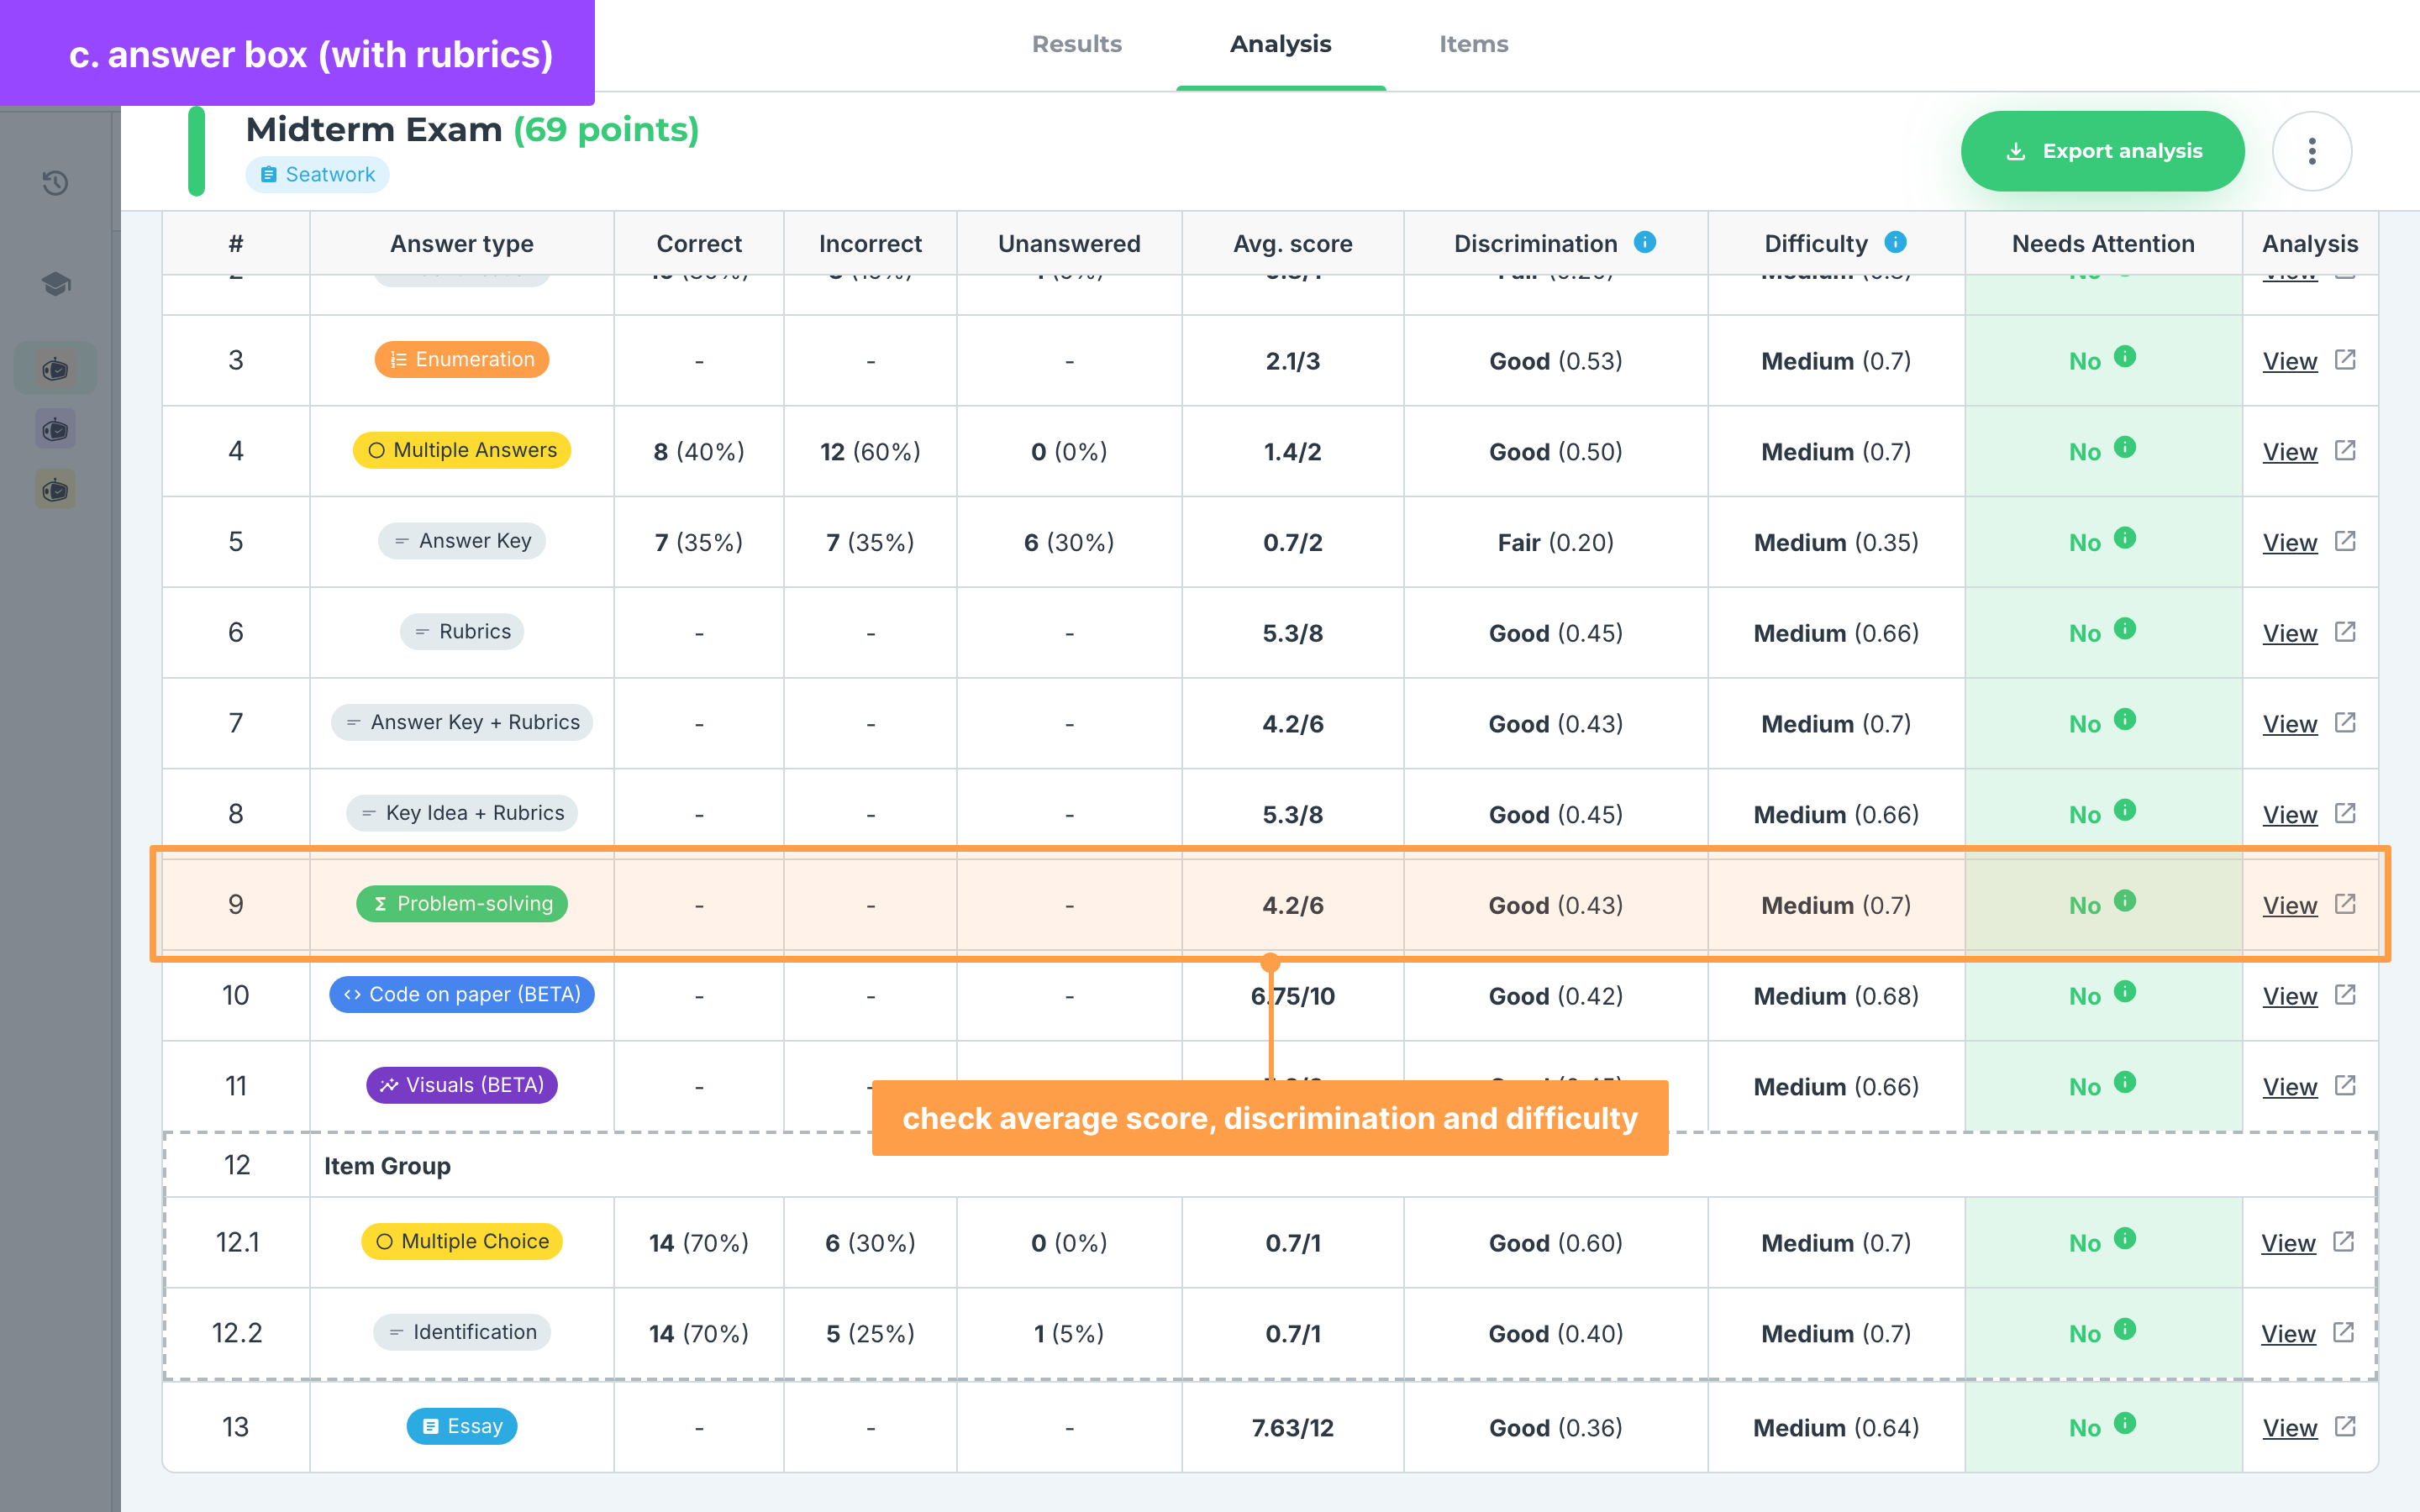
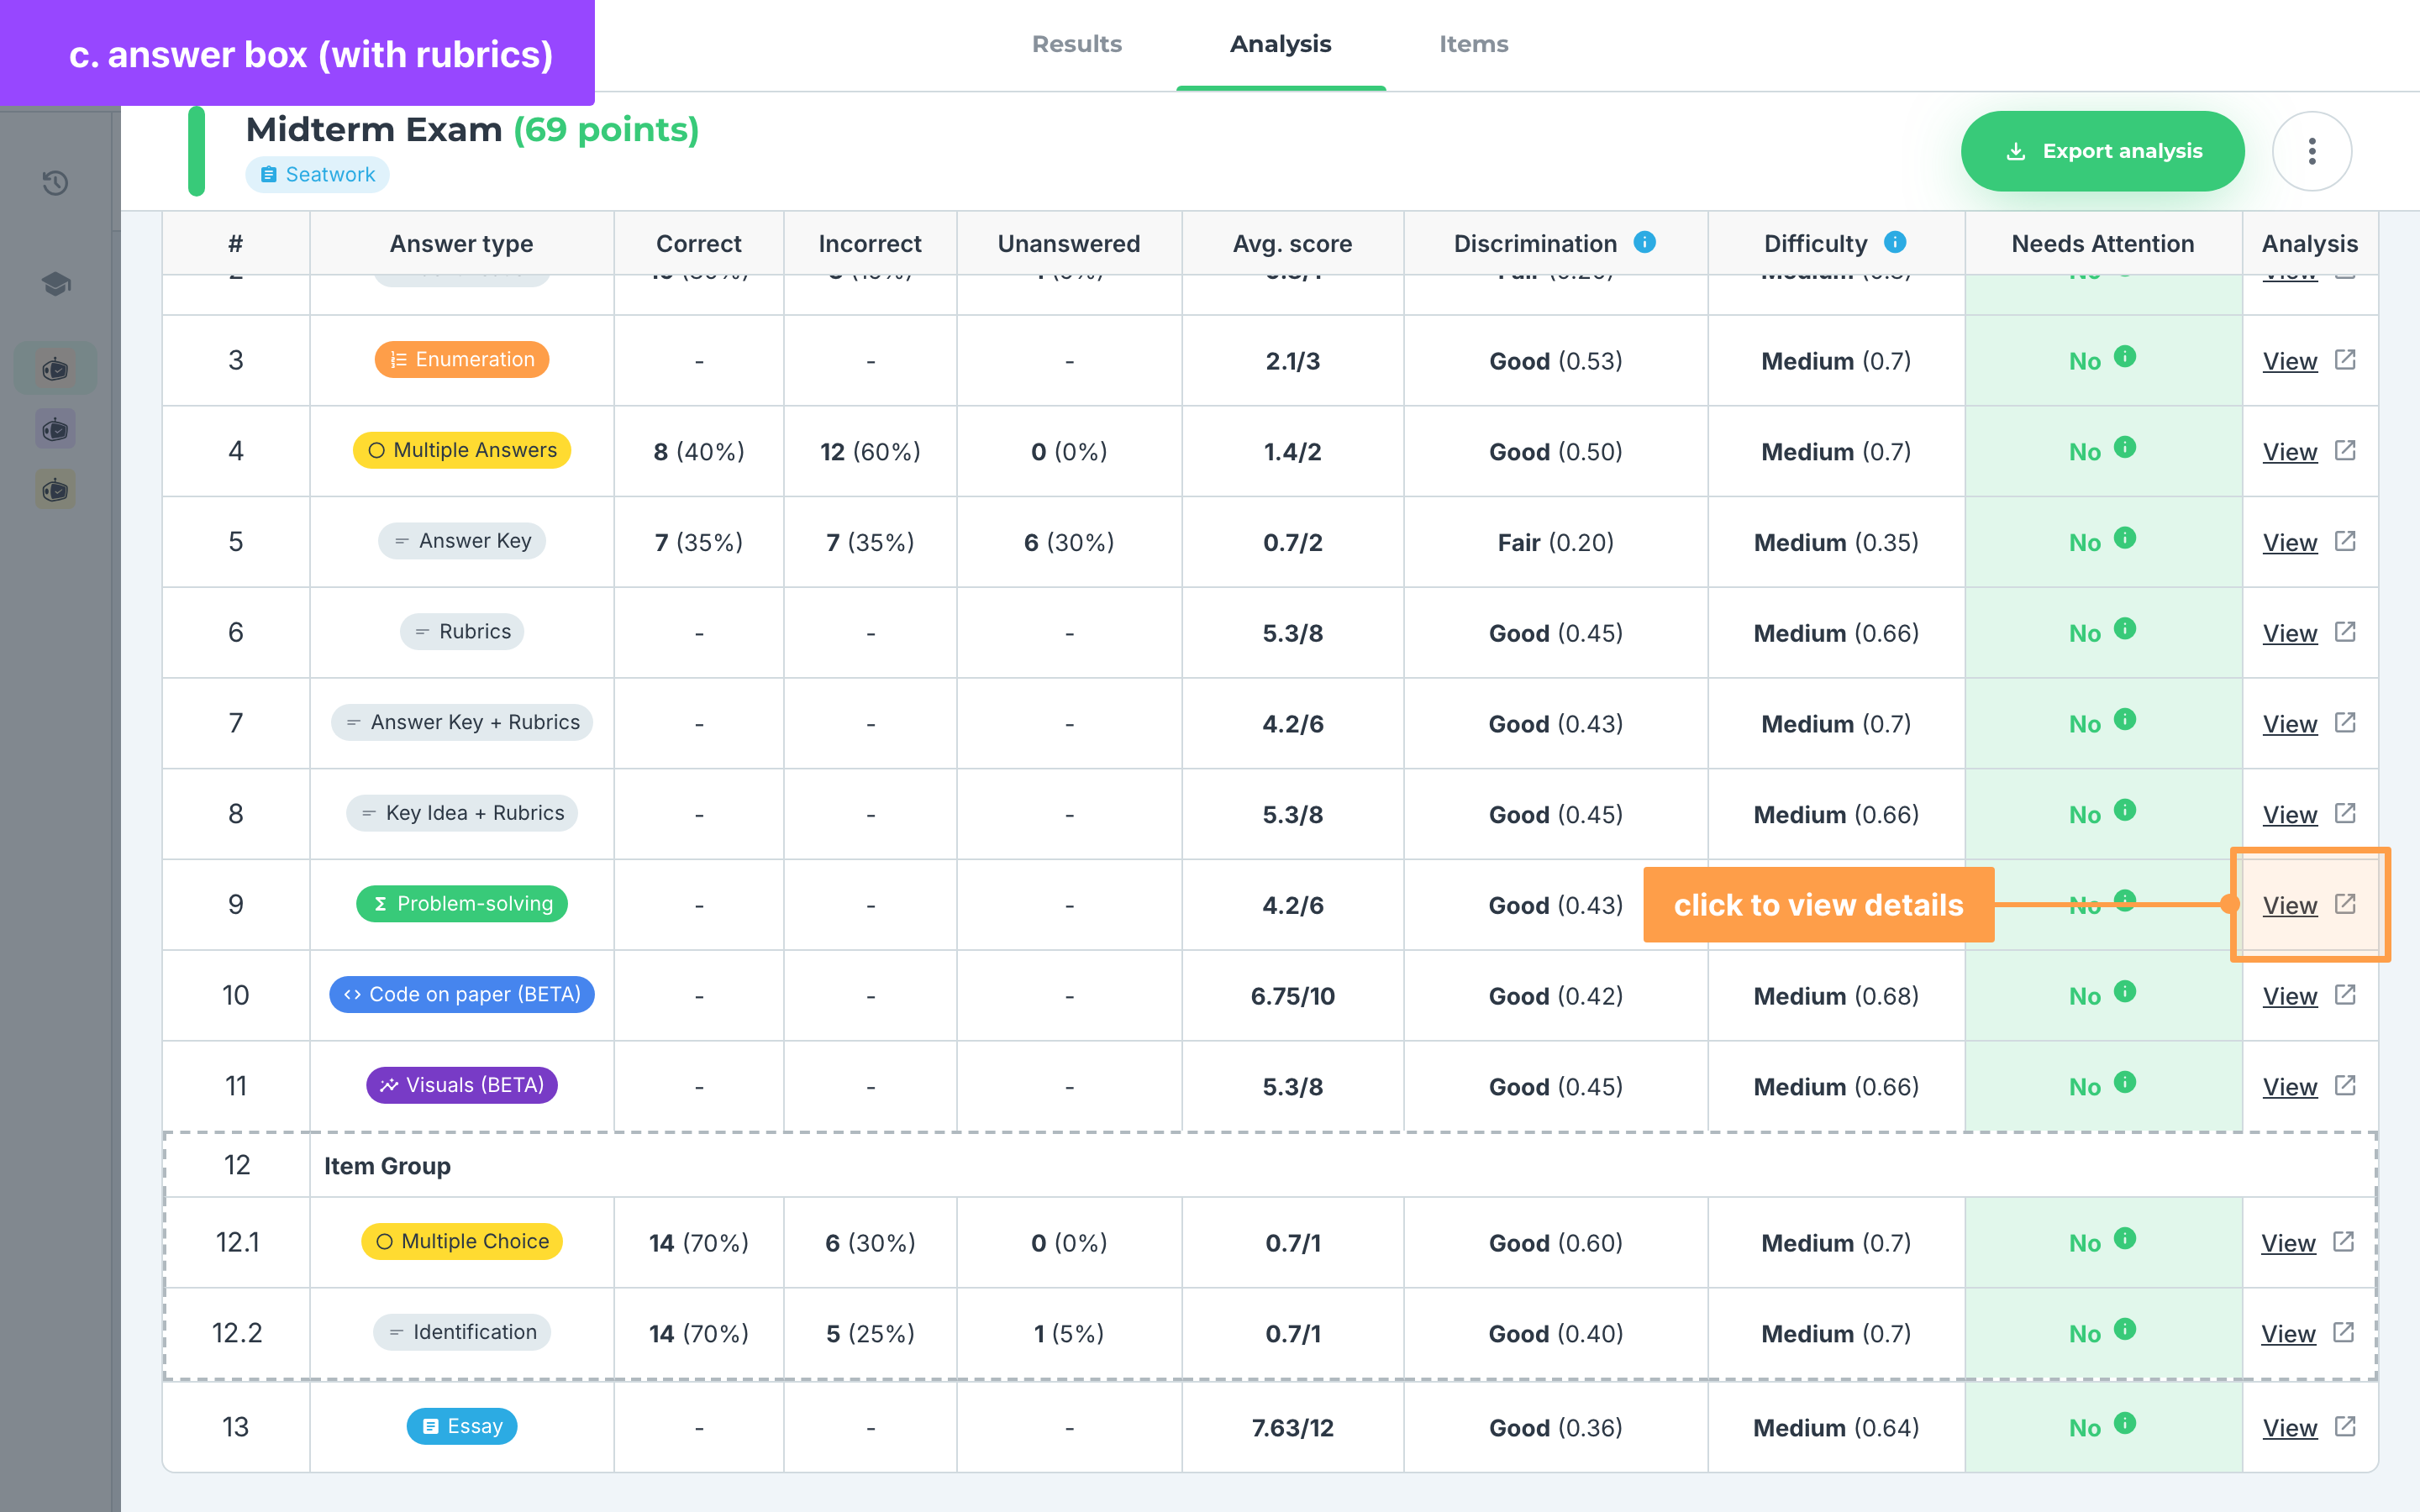
- View here the Average score, Discrimination, and Difficulty value of the item.
- You can see which questions “Needs Attention” indicated by Yes or No in the column.
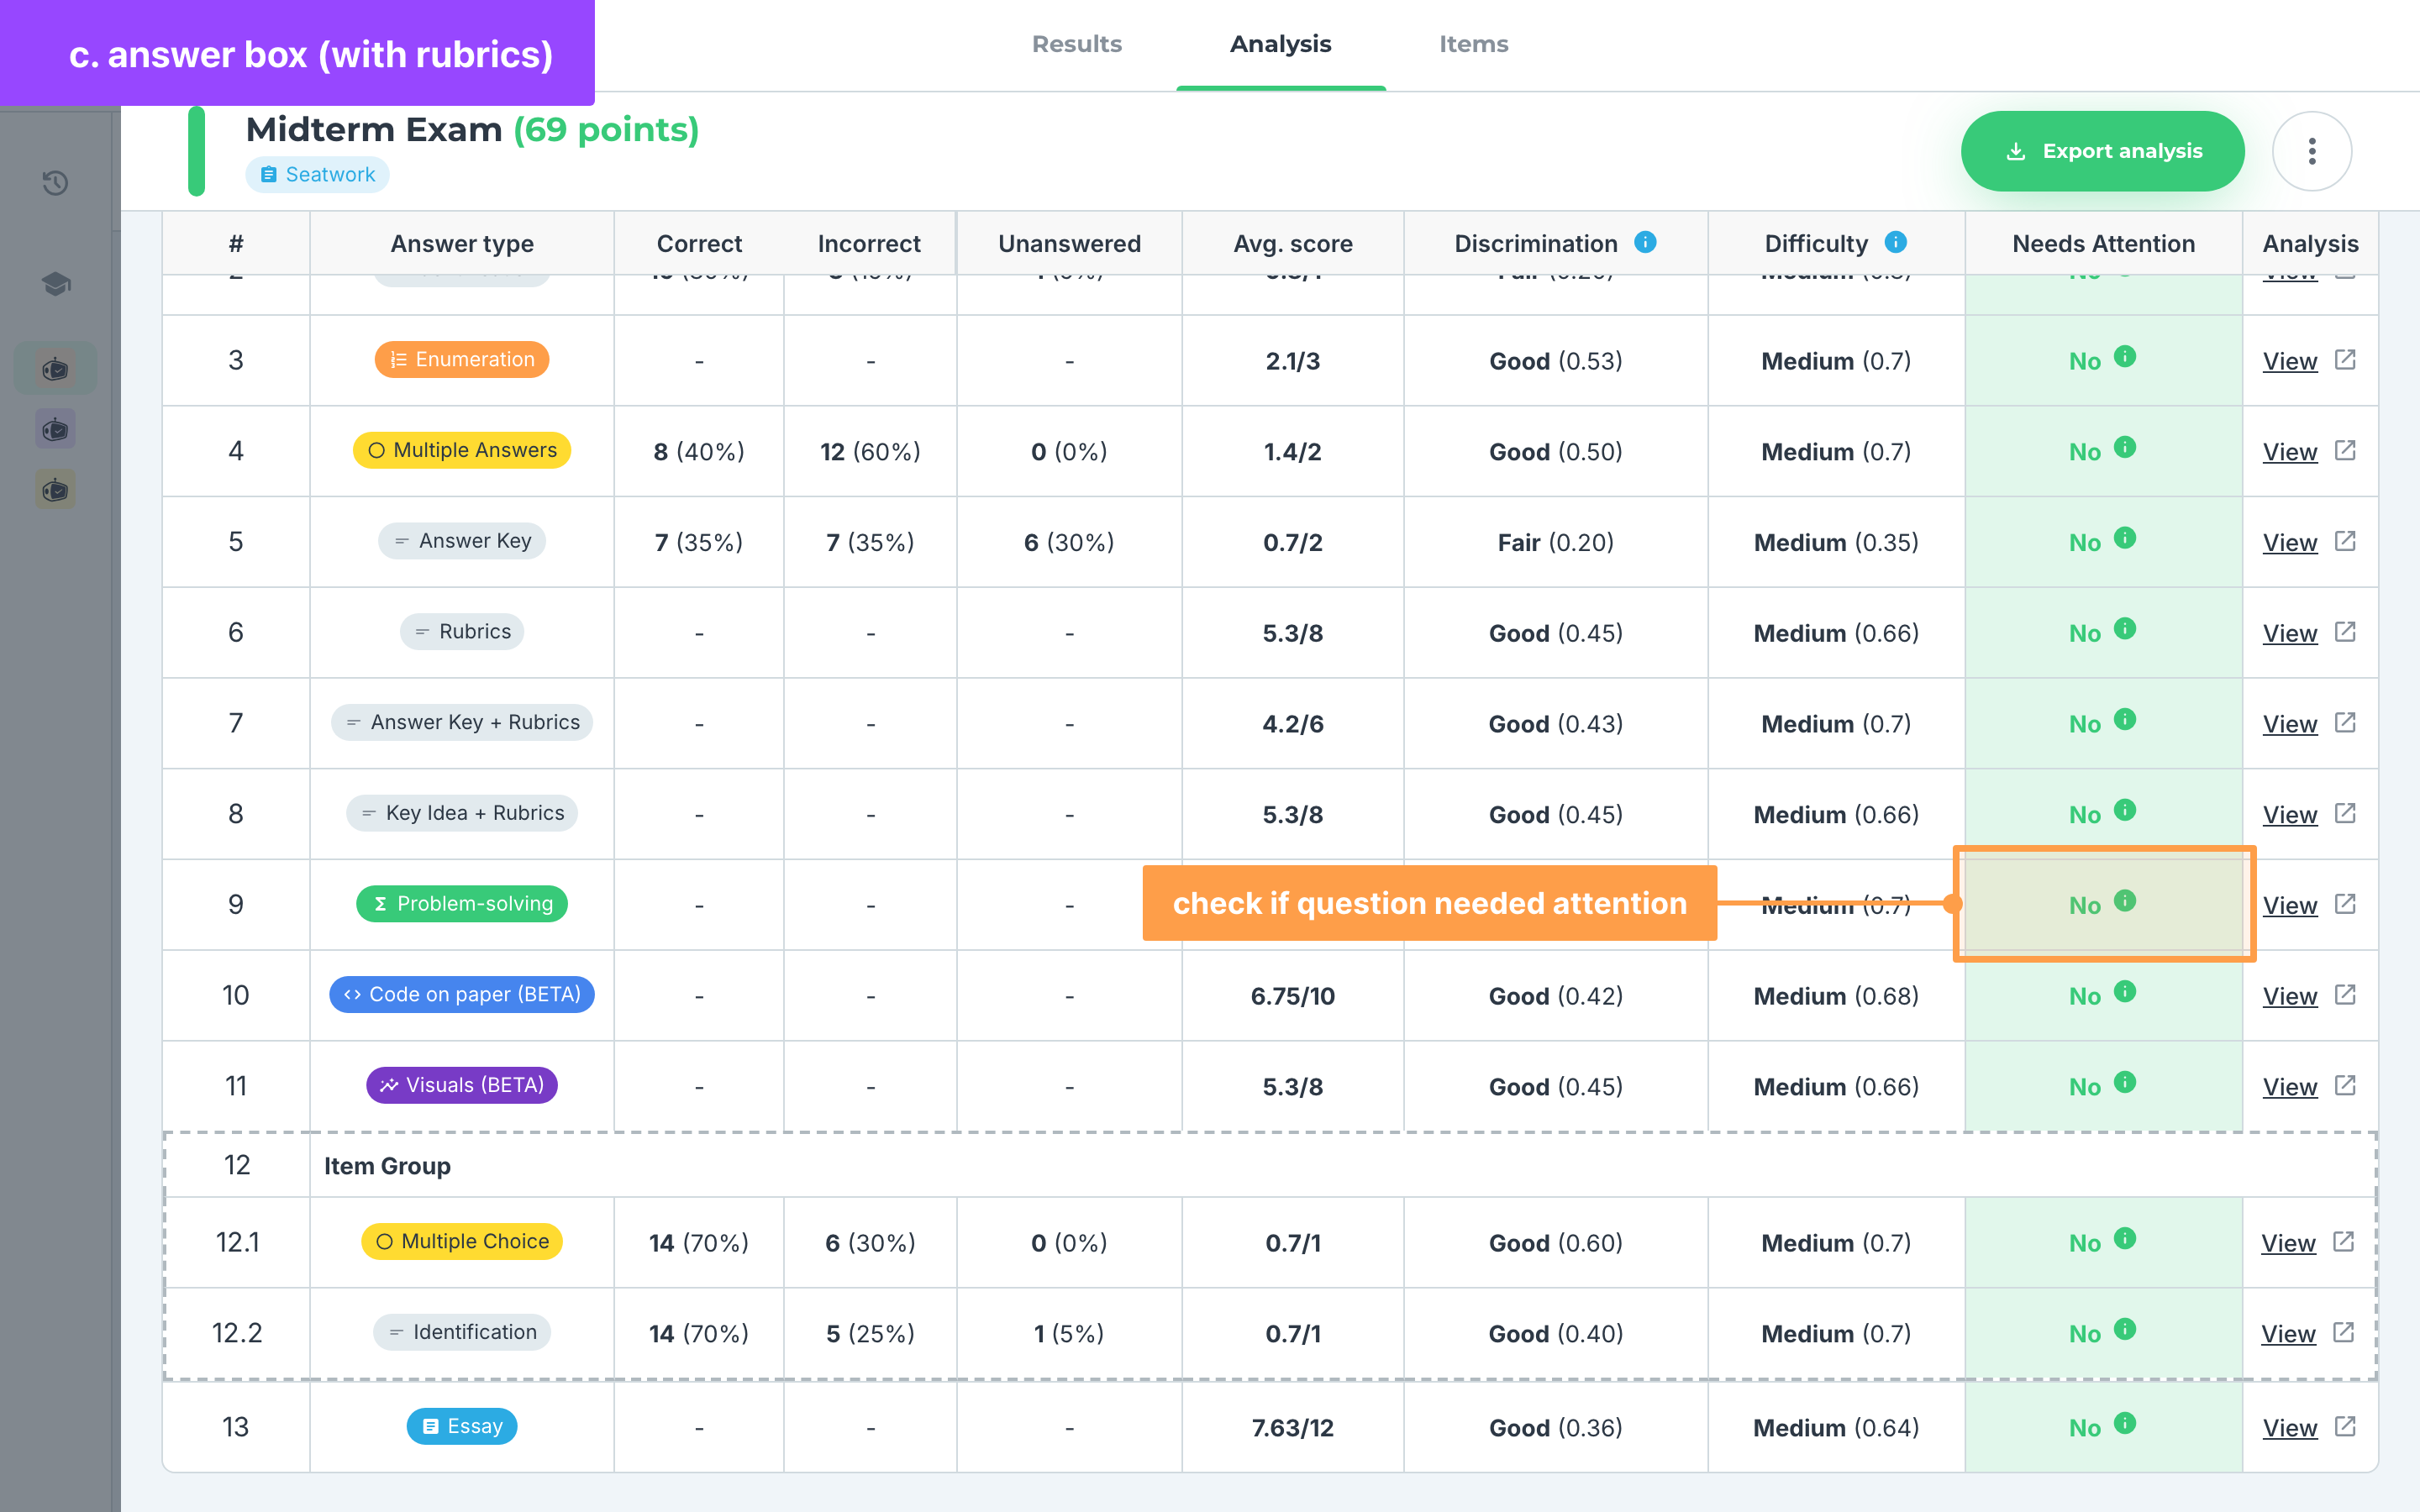
- Click the “View” of the item for a page to open that shows the question’s analytics.
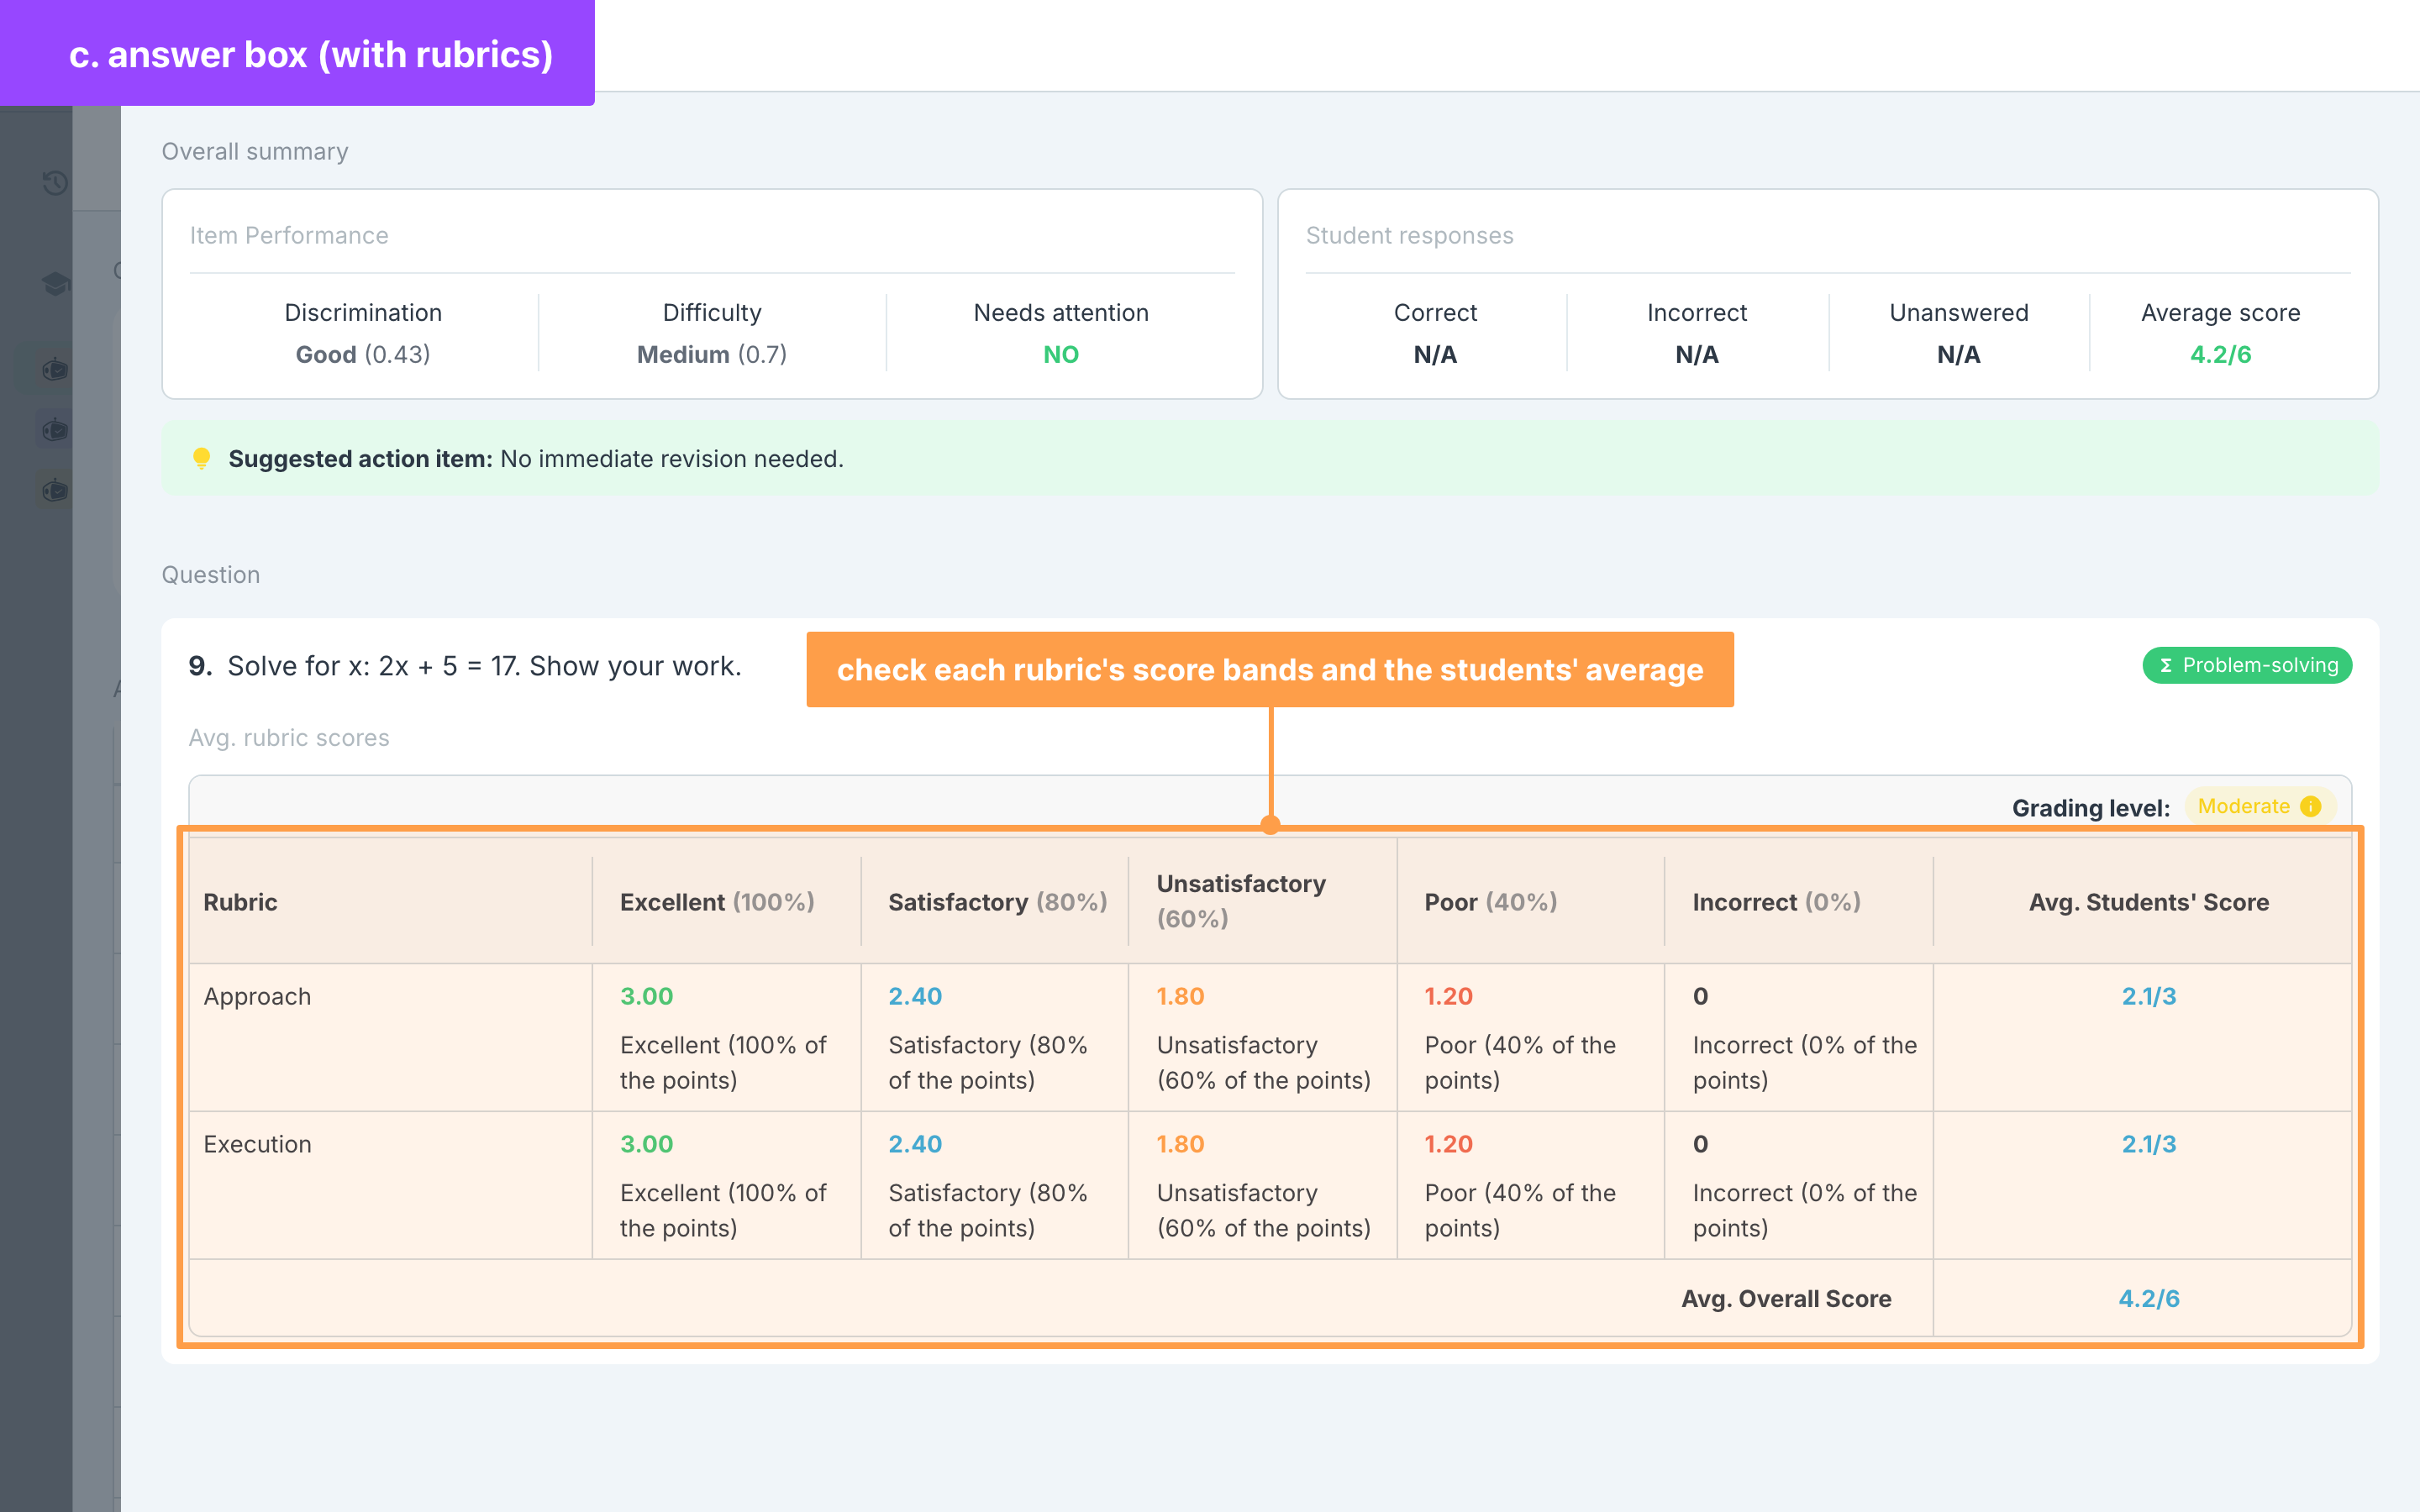
- Once it is open, the page will show the analysis, with one column per score band (Excellent, Satisfactory, Unsatisfactory, Poor, Incorrect) and the class' Avg. Students' Score for each rubric.
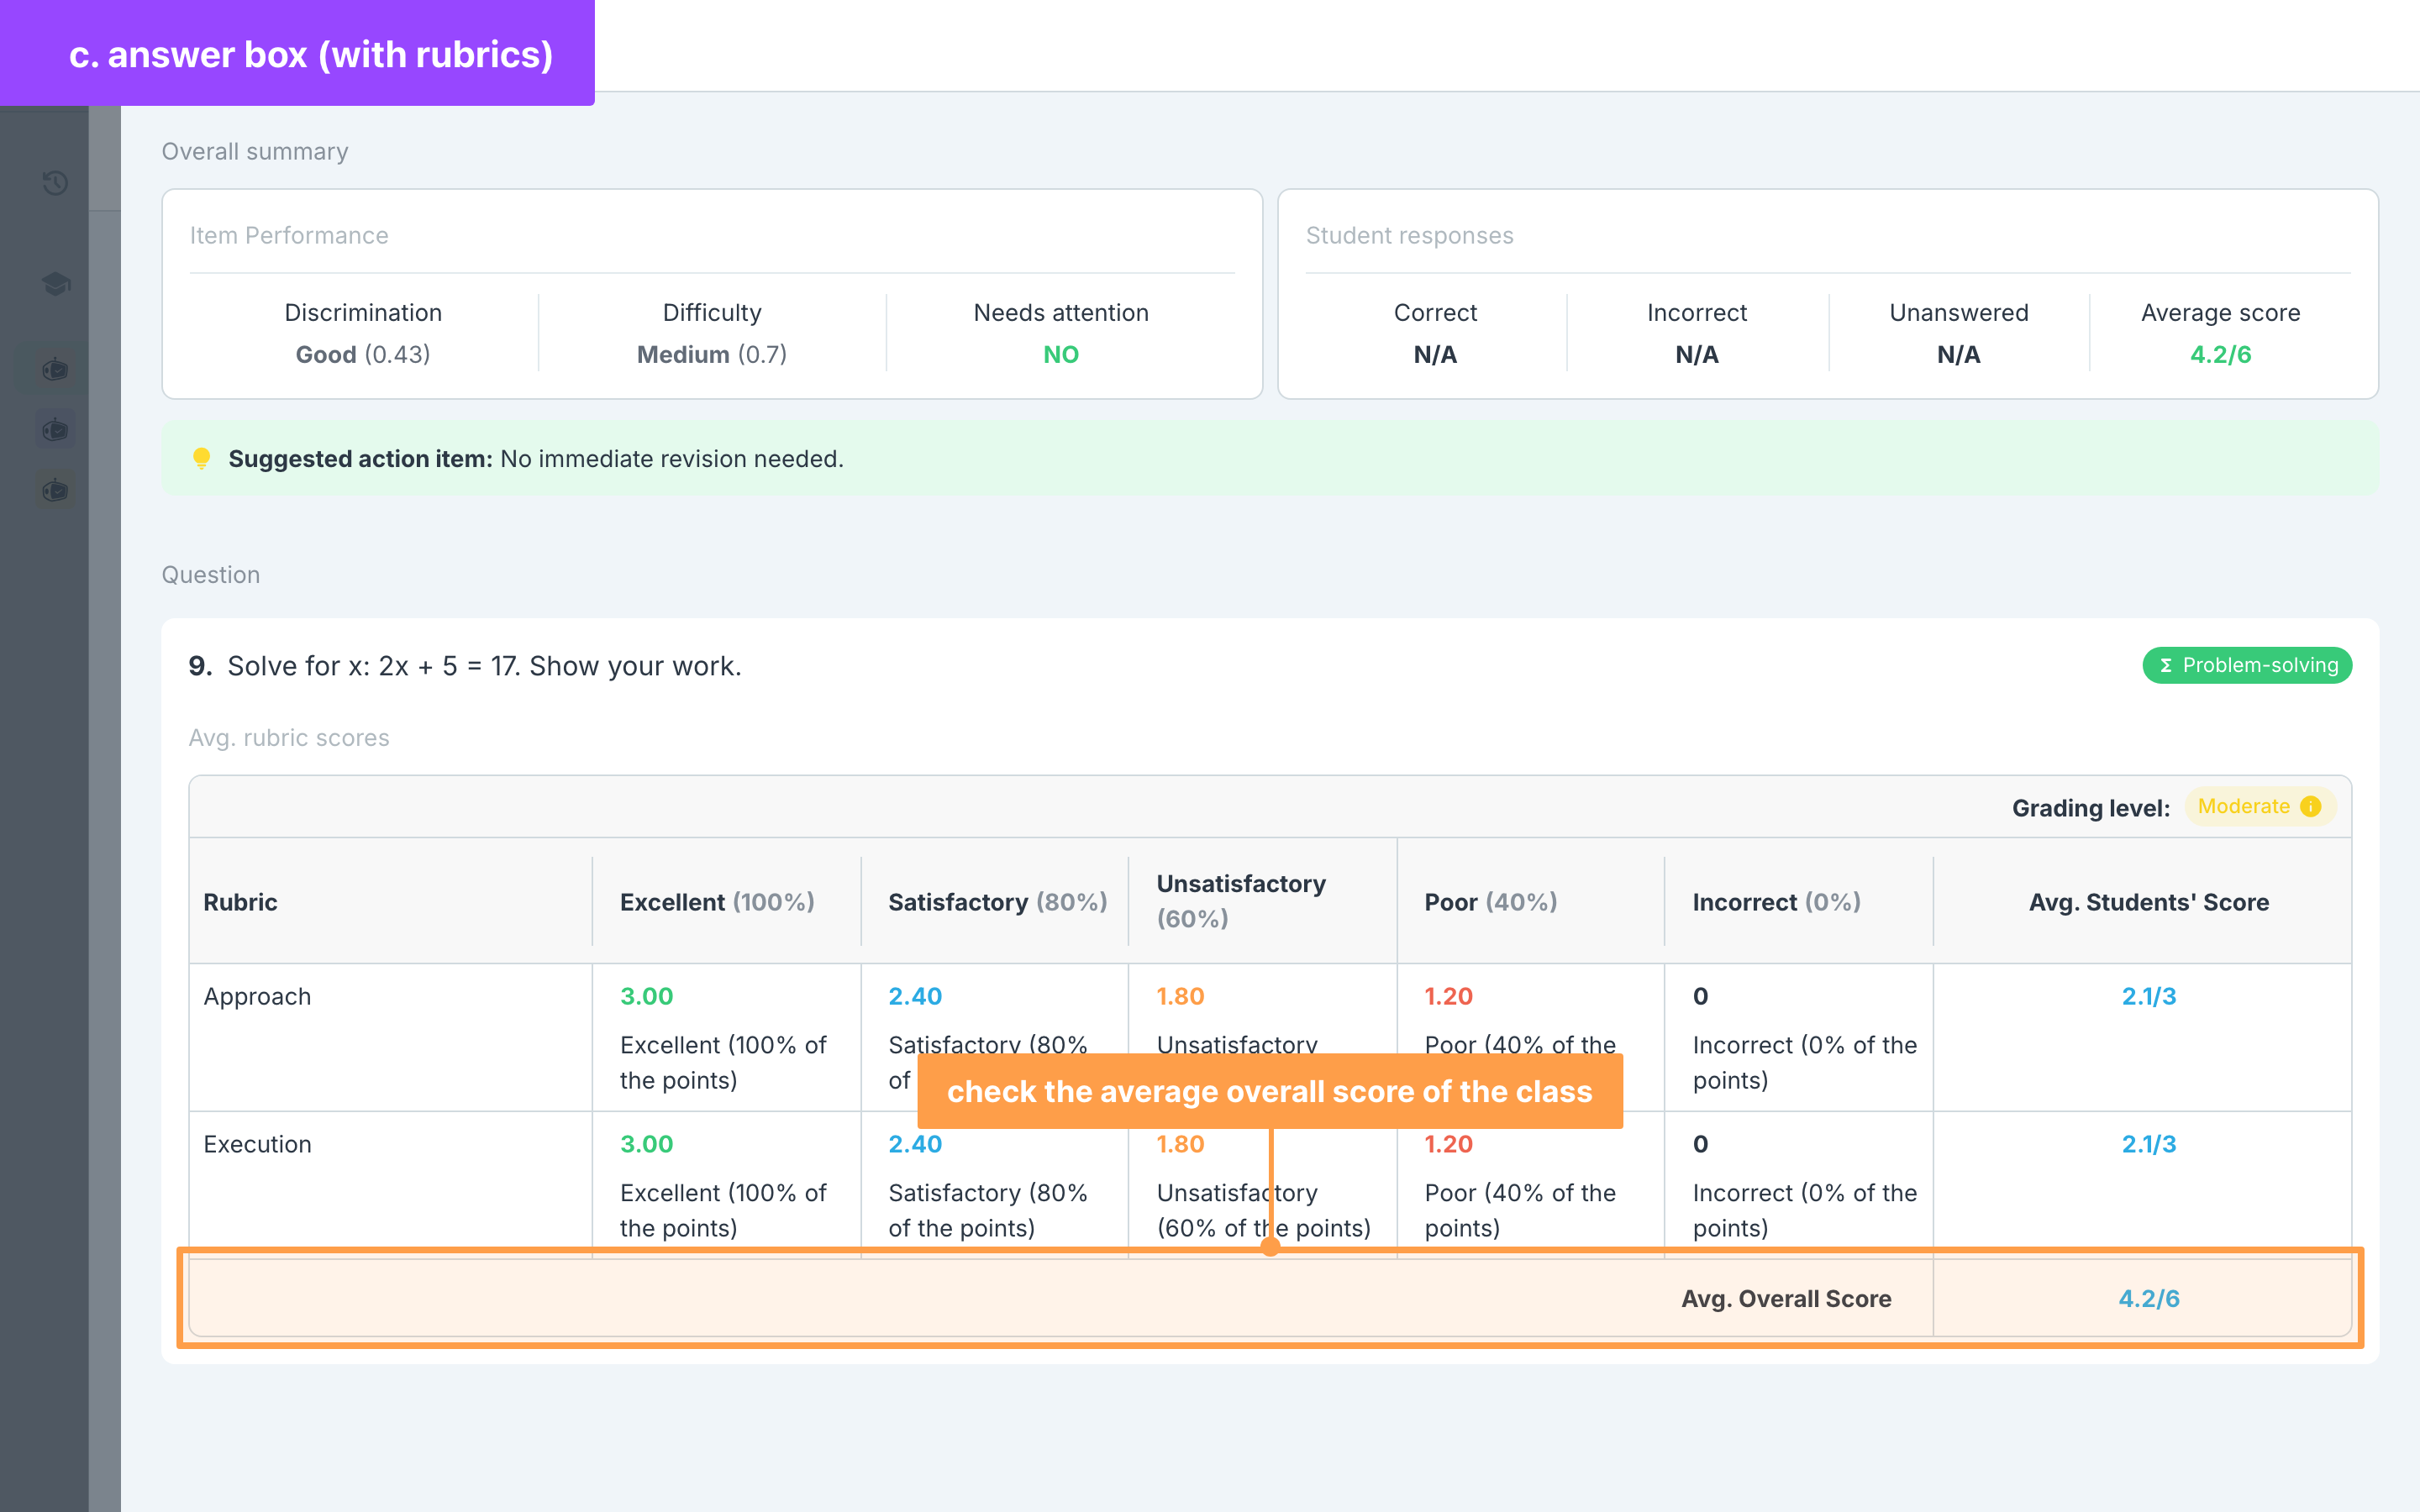
- Then, below the average scores of each rubric is the Avg. Overall Score of the class.
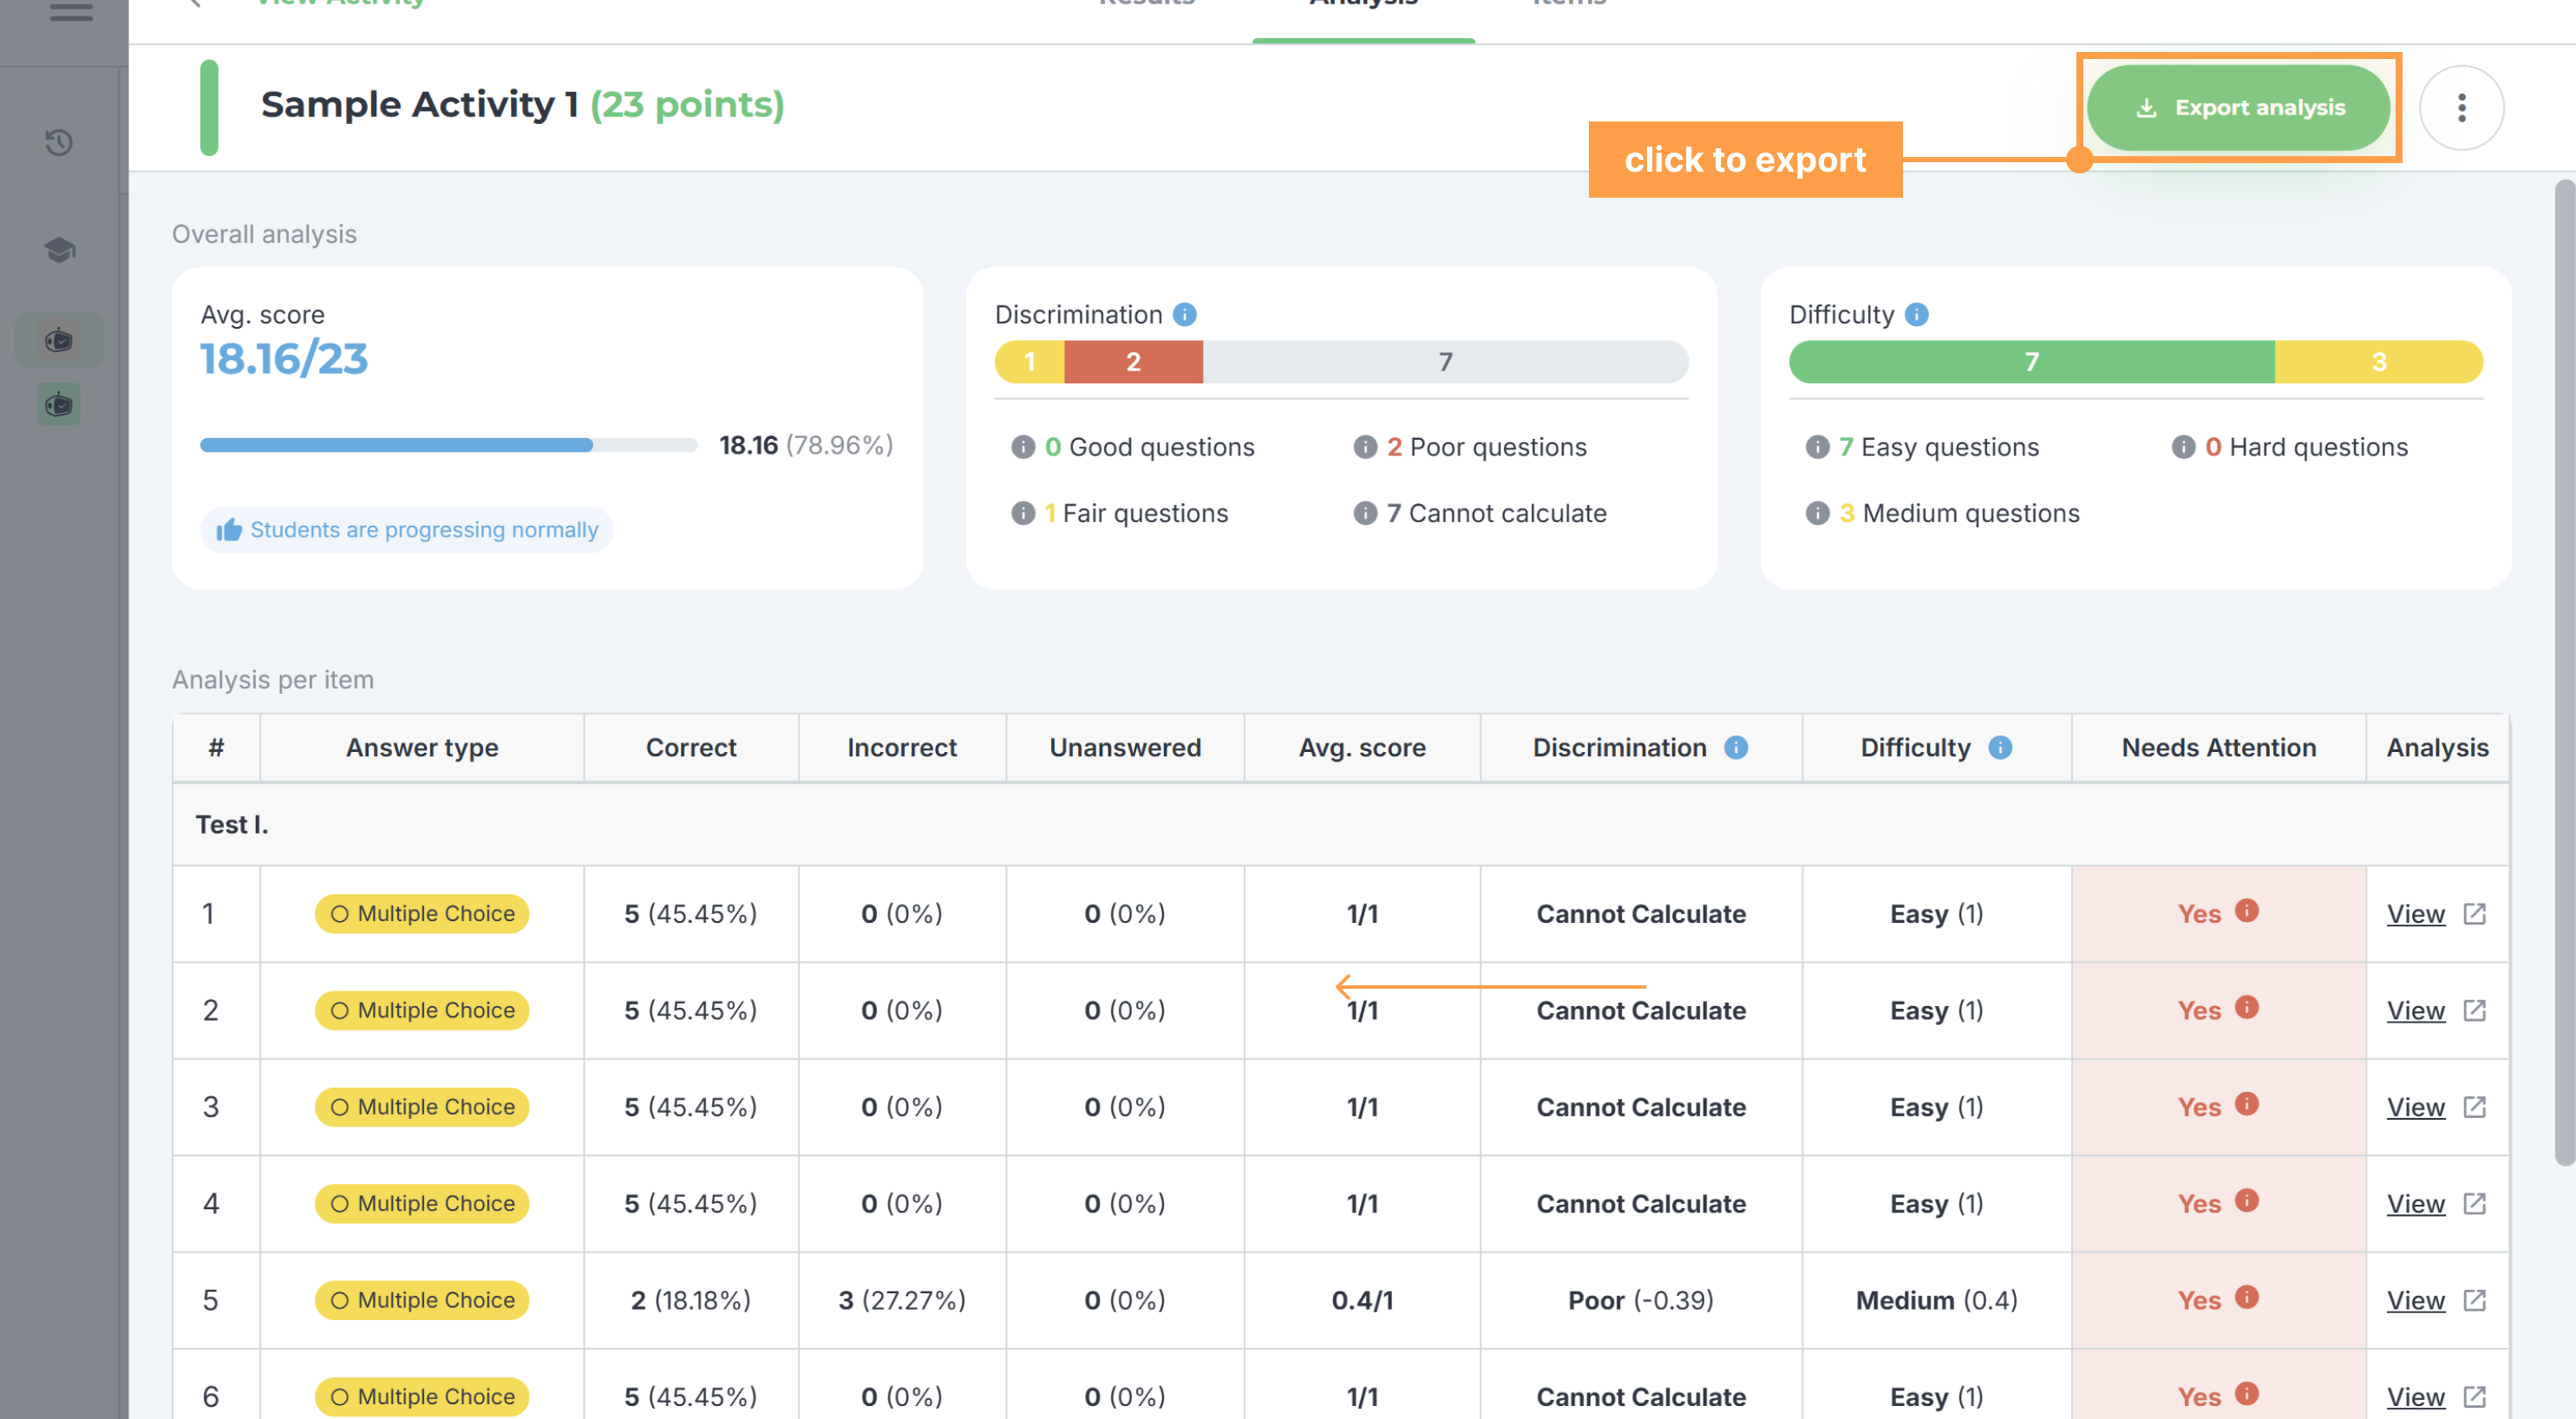
- Lastly, you can export the analysis of the activity for your reports.
And these are the ways to view the activity's analytics for each type of item! Next, let's explore how to export grades in GradeChum.
Last updated March 23, 2026